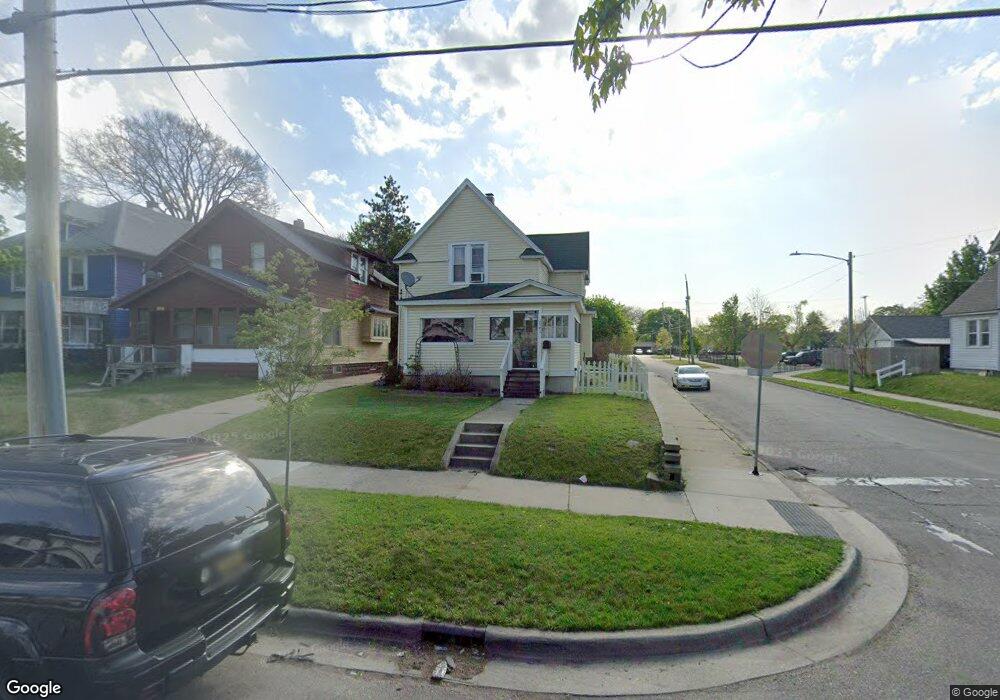
2042 Darwin Ave SW Grand Rapids, MI 49507
Garfield Park NeighborhoodEstimated Value: $182,000 - $200,000
3
Beds
1
Bath
1
Sq Ft
$193,920/Sq Ft
Est. Value
About This Home
This home is located at 2042 Darwin Ave SW, Grand Rapids, MI 49507 and is currently estimated at $193,920, approximately $193,920 per square foot. 2042 Darwin Ave SW is a home located in Kent County with nearby schools including Burton Elementary School, Burton Middle School, and Union High School.
Ownership History
Date
Name
Owned For
Owner Type
Purchase Details
Closed on
Nov 5, 2008
Sold by
Perales Nestor and Perales Maria Irene
Bought by
Mortgage Electronic Registration Systems
Current Estimated Value
Purchase Details
Closed on
Dec 26, 2002
Sold by
Perales Nester and Perales Nestor
Bought by
Perales Nestor and Perales Maria Irene
Home Financials for this Owner
Home Financials are based on the most recent Mortgage that was taken out on this home.
Original Mortgage
$64,800
Interest Rate
8.65%
Purchase Details
Closed on
Dec 23, 2002
Sold by
Kai
Bought by
Gort Hibert F and Gort Lillian G
Home Financials for this Owner
Home Financials are based on the most recent Mortgage that was taken out on this home.
Original Mortgage
$64,800
Interest Rate
8.65%
Purchase Details
Closed on
Feb 19, 1990
Sold by
Gort Gort L L and Gort Perales N
Bought by
Perales Nestor Maria I Ernesto
Purchase Details
Closed on
Feb 12, 1990
Create a Home Valuation Report for This Property
The Home Valuation Report is an in-depth analysis detailing your home's value as well as a comparison with similar homes in the area
Home Values in the Area
Average Home Value in this Area
Purchase History
| Date | Buyer | Sale Price | Title Company |
|---|---|---|---|
| Mortgage Electronic Registration Systems | $17,050 | None Available | |
| Perales Nestor | -- | -- | |
| Perales Nester | $23,250 | -- | |
| Gort Hibert F | -- | -- | |
| Perales Nestor Maria I Ernesto | $23,300 | -- | |
| -- | $23,500 | -- |
Source: Public Records
Mortgage History
| Date | Status | Borrower | Loan Amount |
|---|---|---|---|
| Previous Owner | Perales Nester | $64,800 |
Source: Public Records
Tax History Compared to Growth
Tax History
| Year | Tax Paid | Tax Assessment Tax Assessment Total Assessment is a certain percentage of the fair market value that is determined by local assessors to be the total taxable value of land and additions on the property. | Land | Improvement |
|---|---|---|---|---|
| 2025 | $631 | $81,800 | $0 | $0 |
| 2024 | $631 | $72,400 | $0 | $0 |
| 2023 | $641 | $63,500 | $0 | $0 |
| 2022 | $608 | $48,900 | $0 | $0 |
| 2021 | $595 | $40,400 | $0 | $0 |
| 2020 | $569 | $36,600 | $0 | $0 |
| 2019 | $595 | $32,200 | $0 | $0 |
| 2018 | $575 | $26,100 | $0 | $0 |
| 2017 | $560 | $20,700 | $0 | $0 |
| 2016 | $567 | $20,800 | $0 | $0 |
| 2015 | $527 | $20,800 | $0 | $0 |
| 2013 | -- | $15,500 | $0 | $0 |
Source: Public Records
Map
Nearby Homes
- 140 Stewart St SW
- 29 Sutton St SW
- 2142 Saint Charles Ave SW
- 27 Rose St SW
- 100 Griggs St SW
- 142 Withey St SW
- 1805 Stafford Ave SW
- 26 Banner St SW
- 325 Brown St SW
- 2210 Horton Ave SE
- 46 Dickinson St SW
- 343 Corinne St SW
- 362 Fox St SW
- 358 Fox St SW
- 316 Beulah St SE
- 2347 Jefferson Dr SE
- 2130 Banner Dr SW Unit 21
- 2152 Banner Dr SW
- 2140 Banner Dr SW
- 2446 Woodward Ave SW
- 2038 Darwin Ave SW
- 2100 Darwin Ave SW
- 2034 Darwin Ave SW
- 2106 Darwin Ave SW
- 227 Cutler St SW
- 2030 Darwin Ave SW
- 2110 Darwin Ave SW
- 223 Cutler St SW
- 2028 Darwin Ave SW
- 2112 Darwin Ave SW
- 221 Cutler St SW
- 2049 Darwin Ave SW
- 2045 Darwin Ave SW
- 2039 Darwin Ave SW
- 2024 Darwin Ave SW
- 2035 Darwin Ave SW
- 219 Cutler St SW
- 2116 Darwin Ave SW
- 2107 Darwin Ave SW
- 2033 Darwin Ave SW