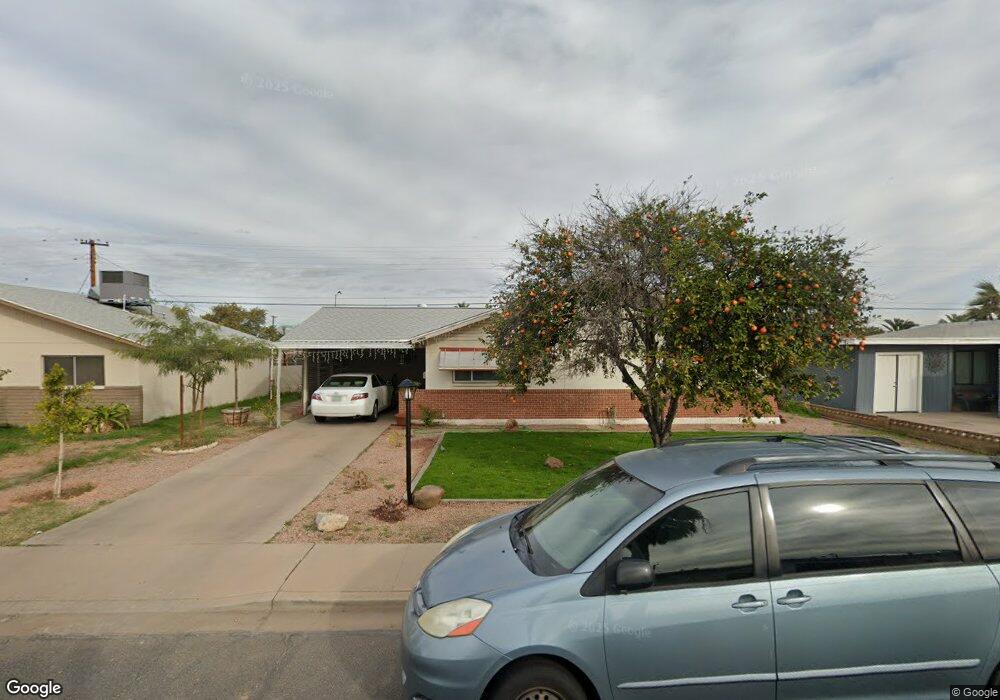
2042 E Bramble Ave Mesa, AZ 85204
Central Mesa NeighborhoodEstimated Value: $297,000 - $364,000
Studio
2
Baths
1,332
Sq Ft
$254/Sq Ft
Est. Value
About This Home
This home is located at 2042 E Bramble Ave, Mesa, AZ 85204 and is currently estimated at $338,390, approximately $254 per square foot. 2042 E Bramble Ave is a home located in Maricopa County with nearby schools including Franklin at Brimhall Elementary School, Franklin West Elementary School, and Franklin Accelerated Academy Jordan Campus.
Ownership History
Date
Name
Owned For
Owner Type
Purchase Details
Closed on
Feb 3, 2022
Sold by
Us Home Group Llc
Bought by
Hernandez Jose L
Current Estimated Value
Home Financials for this Owner
Home Financials are based on the most recent Mortgage that was taken out on this home.
Original Mortgage
$220,999
Outstanding Balance
$204,965
Interest Rate
3.45%
Mortgage Type
New Conventional
Estimated Equity
$133,425
Purchase Details
Closed on
Jan 14, 2022
Sold by
Bramble Partners
Bought by
Us Home Group Llc
Home Financials for this Owner
Home Financials are based on the most recent Mortgage that was taken out on this home.
Original Mortgage
$220,999
Outstanding Balance
$204,965
Interest Rate
3.45%
Mortgage Type
New Conventional
Estimated Equity
$133,425
Purchase Details
Closed on
Nov 2, 2021
Sold by
Colwell Starlyn L
Bought by
Bramble Partners
Purchase Details
Closed on
Jul 31, 1995
Sold by
Sutherland Ruth E
Bought by
Colwell Wanda J
Create a Home Valuation Report for This Property
The Home Valuation Report is an in-depth analysis detailing your home's value as well as a comparison with similar homes in the area
Home Values in the Area
Average Home Value in this Area
Purchase History
| Date | Buyer | Sale Price | Title Company |
|---|---|---|---|
| Hernandez Jose L | $319,999 | Fidelity National Title | |
| Us Home Group Llc | $280,000 | Fidelity National Title | |
| Bramble Partners | -- | None Available | |
| Colwell Wanda J | $60,000 | Grand Canyon Title Agency In |
Source: Public Records
Mortgage History
| Date | Status | Borrower | Loan Amount |
|---|---|---|---|
| Open | Hernandez Jose L | $220,999 |
Source: Public Records
Tax History
| Year | Tax Paid | Tax Assessment Tax Assessment Total Assessment is a certain percentage of the fair market value that is determined by local assessors to be the total taxable value of land and additions on the property. | Land | Improvement |
|---|---|---|---|---|
| 2025 | $727 | $8,749 | -- | -- |
| 2024 | $734 | $8,332 | -- | -- |
| 2023 | $734 | $26,220 | $5,240 | $20,980 |
| 2022 | $718 | $18,780 | $3,750 | $15,030 |
| 2021 | $738 | $17,100 | $3,420 | $13,680 |
| 2020 | $728 | $15,550 | $3,110 | $12,440 |
| 2019 | $675 | $13,870 | $2,770 | $11,100 |
| 2018 | $644 | $12,450 | $2,490 | $9,960 |
| 2017 | $624 | $10,710 | $2,140 | $8,570 |
| 2016 | $613 | $9,000 | $1,800 | $7,200 |
| 2015 | $578 | $8,910 | $1,780 | $7,130 |
Source: Public Records
Map
Nearby Homes
- 2115 E Birchwood Ave
- 2124 E 3rd Dr
- 2127 E Bayberry Ave
- 2100 E Alpine Cir
- 2111 E Main St
- 2036 E Marilyn Ave
- 1750 E 1st Ave
- 1909 E 6th Ave
- 1649 E Dana Ave
- 2226 E Diamond Ave
- 429 S Gaylord
- 150 S Windsor Unit R128
- 150 S Windsor Unit E65
- 150 S Windsor Unit 35
- 150 S Windsor Unit 139
- 150 S Windsor Unit 34
- 150 S Windsor Unit 127
- 228 South Hill
- 335 S Harris Dr
- 2601 E Allred Ave Unit 11
- 2050 E Bramble Ave
- 2036 E Bramble Ave
- 2039 E Birchwood Ave
- 2056 E Bramble Ave
- 2030 E Bramble Ave
- 2043 E Bramble Ave
- 2033 E Birchwood Ave Unit 325
- 2033 E Birchwood Ave
- 2059 E Birchwood Ave
- 2037 E Bramble Ave
- 2051 E Bramble Ave
- 2031 E Bramble Ave
- 2057 E Bramble Ave
- 2024 E Bramble Ave
- 2062 E Bramble Ave
- 2025 E Birchwood Ave
- 2061 E Birchwood Ave
- 2025 E Bramble Ave
- 2063 E Bramble Ave
- 2042 E 3rd Dr
Your Personal Tour Guide
Ask me questions while you tour the home.