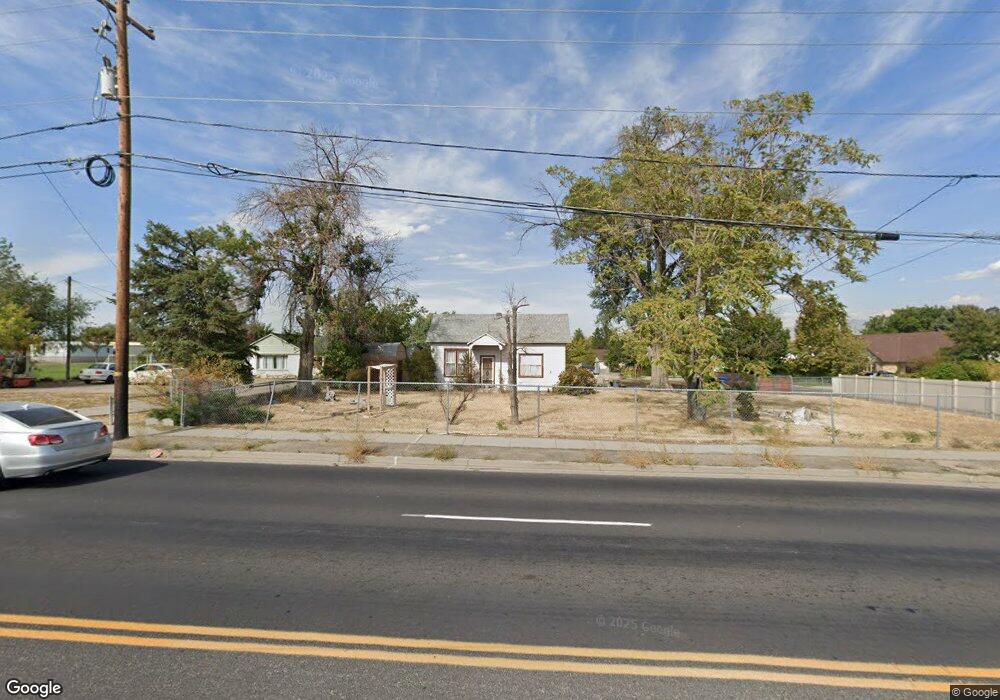
2042 W 6200 S Salt Lake City, UT 84129
Estimated Value: $331,000 - $421,000
2
Beds
1
Bath
942
Sq Ft
$410/Sq Ft
Est. Value
About This Home
This home is located at 2042 W 6200 S, Salt Lake City, UT 84129 and is currently estimated at $386,568, approximately $410 per square foot. 2042 W 6200 S is a home located in Salt Lake County with nearby schools including Calvin S Smith Elementary School, Bennion Junior High School, and Taylorsville High School.
Ownership History
Date
Name
Owned For
Owner Type
Purchase Details
Closed on
Jun 27, 2022
Sold by
Henrietta Romero
Bought by
Henrietta Romero Living Trust
Current Estimated Value
Purchase Details
Closed on
Sep 20, 2001
Sold by
Shelton Henrietta and Romero Henrietta
Bought by
Romero Henrietta
Home Financials for this Owner
Home Financials are based on the most recent Mortgage that was taken out on this home.
Original Mortgage
$81,000
Interest Rate
6.49%
Purchase Details
Closed on
Oct 4, 1995
Sold by
Lund Kelly H and Lund Mary A
Bought by
Shelton Henrietta
Home Financials for this Owner
Home Financials are based on the most recent Mortgage that was taken out on this home.
Original Mortgage
$61,750
Interest Rate
7.92%
Purchase Details
Closed on
Feb 22, 1994
Sold by
Searle Rodney
Bought by
Lund Kelly H and Lund Mary A
Home Financials for this Owner
Home Financials are based on the most recent Mortgage that was taken out on this home.
Original Mortgage
$27,930
Interest Rate
6.47%
Create a Home Valuation Report for This Property
The Home Valuation Report is an in-depth analysis detailing your home's value as well as a comparison with similar homes in the area
Home Values in the Area
Average Home Value in this Area
Purchase History
| Date | Buyer | Sale Price | Title Company |
|---|---|---|---|
| Henrietta Romero Living Trust | -- | -- | |
| Romero Henrietta | -- | Title One | |
| Shelton Henrietta | -- | -- | |
| Lund Kelly H | -- | -- |
Source: Public Records
Mortgage History
| Date | Status | Borrower | Loan Amount |
|---|---|---|---|
| Previous Owner | Romero Henrietta | $81,000 | |
| Previous Owner | Shelton Henrietta | $61,750 | |
| Previous Owner | Lund Kelly H | $27,930 |
Source: Public Records
Tax History Compared to Growth
Tax History
| Year | Tax Paid | Tax Assessment Tax Assessment Total Assessment is a certain percentage of the fair market value that is determined by local assessors to be the total taxable value of land and additions on the property. | Land | Improvement |
|---|---|---|---|---|
| 2025 | $378 | $280,400 | $171,800 | $108,600 |
| 2024 | $378 | $284,600 | $165,900 | $118,700 |
| 2023 | $490 | $261,600 | $122,000 | $139,600 |
| 2022 | $416 | $270,000 | $119,600 | $150,400 |
| 2021 | $741 | $201,500 | $85,400 | $116,100 |
| 2020 | $1,329 | $177,700 | $85,400 | $92,300 |
| 2019 | $279 | $175,800 | $74,300 | $101,500 |
| 2018 | $1,236 | $155,600 | $74,300 | $81,300 |
| 2017 | $1,126 | $149,000 | $74,300 | $74,700 |
| 2016 | $1,068 | $141,300 | $84,200 | $57,100 |
| 2015 | $1,019 | $126,000 | $100,000 | $26,000 |
| 2014 | $939 | $114,000 | $91,900 | $22,100 |
Source: Public Records
Map
Nearby Homes
- 2137 W 6200 S
- 2126 W Happiness Dr
- 2342 W 6200 S
- 5924 S Jordan Canal Rd
- 2332 Broderick Dr
- 2322 W Surrey Rd
- 2250 W Tierra Rose Dr
- 2333 W Ledgewood Dr
- 2337 Sharron Dr
- 6189 S Elderberry Ln
- 1506 W 6235 S
- 6653 S 2200 W
- 1471 W 6170 S
- 6683 Alice Susanna Ln
- 1501 W Bluemont Dr
- 6474 Tamra Dr
- 1481 W Bluemont Dr
- 2579 W 5780 S
- 1429 Connie Way
- 2127 Cedar Breaks Dr
- 2068 W 6200 S
- 2068 W 6200 S
- 6156 S Bennion View Ct
- 2024 W 6200 S
- 6161 S Bennion View Ct
- 6161 Bennion View Ct
- 6148 Bennion View Ct
- 2031 W 6200 S
- 2045 W 6200 S
- 6149 Bennion View Ct
- 6149 S Bennion View Ct
- 2063 W 6200 S
- 2031 W 6200 S
- 2075 W 6200 S
- 6136 Bennion View Ct
- 6216 Margray Dr
- 6216 S Margray Dr
- 6137 Bennion View Ct
- 6137 S Bennion View Ct
- 2091 W 6200 S