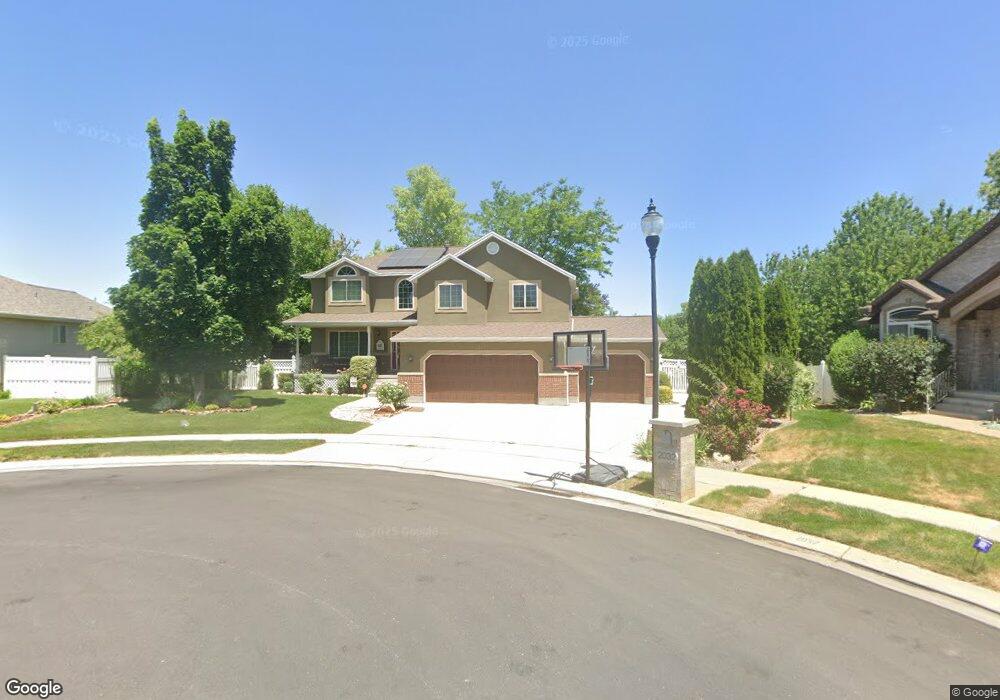
2042 W 8820 S West Jordan, UT 84088
Estimated Value: $701,000 - $831,000
3
Beds
3
Baths
2,007
Sq Ft
$377/Sq Ft
Est. Value
About This Home
This home is located at 2042 W 8820 S, West Jordan, UT 84088 and is currently estimated at $755,924, approximately $376 per square foot. 2042 W 8820 S is a home located in Salt Lake County with nearby schools including Westvale Elementary School, West Jordan Middle School, and West Jordan High School.
Ownership History
Date
Name
Owned For
Owner Type
Purchase Details
Closed on
Feb 2, 2017
Sold by
Afjs Holdings Llc
Bought by
Harderock Homes Llc
Current Estimated Value
Purchase Details
Closed on
Aug 23, 2011
Sold by
Ehlert Jack R
Bought by
Ehlert Jack R and Ehlert Michele L
Purchase Details
Closed on
May 15, 2010
Sold by
Ehlert Jack R and Ehlert Ilse W
Bought by
Ehlert Jack R
Purchase Details
Closed on
Oct 29, 1997
Sold by
Tiffany Homes Inc
Bought by
Ehlert Jack R and Ehlert Ilse W
Home Financials for this Owner
Home Financials are based on the most recent Mortgage that was taken out on this home.
Original Mortgage
$150,000
Interest Rate
7.36%
Purchase Details
Closed on
Nov 3, 1995
Sold by
Gardens Of Mountain View Lc
Bought by
Tiffany Homes Inc
Create a Home Valuation Report for This Property
The Home Valuation Report is an in-depth analysis detailing your home's value as well as a comparison with similar homes in the area
Home Values in the Area
Average Home Value in this Area
Purchase History
| Date | Buyer | Sale Price | Title Company |
|---|---|---|---|
| Harderock Homes Llc | -- | Integrated Title Ins Service | |
| Ehlert Jack R | -- | None Available | |
| Ehlert Jack R | -- | None Available | |
| Ehlert Jack R | -- | -- | |
| Tiffany Homes Inc | -- | -- |
Source: Public Records
Mortgage History
| Date | Status | Borrower | Loan Amount |
|---|---|---|---|
| Previous Owner | Ehlert Jack R | $150,000 |
Source: Public Records
Tax History Compared to Growth
Tax History
| Year | Tax Paid | Tax Assessment Tax Assessment Total Assessment is a certain percentage of the fair market value that is determined by local assessors to be the total taxable value of land and additions on the property. | Land | Improvement |
|---|---|---|---|---|
| 2025 | -- | $674,200 | $196,200 | $478,000 |
| 2024 | -- | $643,300 | $181,000 | $462,300 |
| 2023 | $515 | $618,500 | $170,700 | $447,800 |
| 2022 | $515 | $610,400 | $167,400 | $443,000 |
| 2021 | $176 | $473,000 | $135,000 | $338,000 |
| 2020 | $2,745 | $418,300 | $135,000 | $283,300 |
| 2019 | $2,748 | $410,700 | $135,000 | $275,700 |
| 2018 | $2,596 | $384,800 | $99,000 | $285,800 |
| 2017 | $2,426 | $358,000 | $99,000 | $259,000 |
| 2016 | $2,193 | $304,100 | $99,000 | $205,100 |
| 2015 | $2,141 | $289,400 | $103,700 | $185,700 |
| 2014 | $1,986 | $264,300 | $96,200 | $168,100 |
Source: Public Records
Map
Nearby Homes
- 2041 W 8820 S
- 8859 S Long Dr
- 1773 W 8760 S
- 1633 W Rockaway Ln
- 2286 Williamsburg Cir
- 2223 W Williamsburg Cir
- 8534 S Redwood Rd
- 8518 S Redwood Rd
- 8510 S Redwood Rd
- 9252 S 2040 W Unit D
- 1968 W 9270 S Unit C
- 2177 W 9240 S
- 8383 S 2200 W
- 2116 W Abbey View Rd
- 8461 S 2385 W
- 77 Rio Bravo Place
- 14 San Miguel St
- 1424 Stone Meadow Dr
- 2097 Jordan Villa Dr
- 2636 W 9110 S
- 2035 W 8780 S
- 2032 W 8820 S Unit 215
- 2056 W 8820 S
- 8791 S 2070 W
- 8782 S Okubo Dr
- 8812 S Okubo Dr
- 8822 S Okubo Dr
- 2041 W 8820 S Unit 216
- 2057 W 8820 S
- 2036 W 8780 S
- 8834 S Okubo Dr
- 8766 S Okubo Dr
- 2054 W 8780 S
- 2044 W 8870 S
- 8798 S 2070 W
- 8816 S 2070 W
- 1997 W Rio Verde Cove
- 2058 W 8870 S
- 8784 S 2070 W
- 8832 S 2070 W