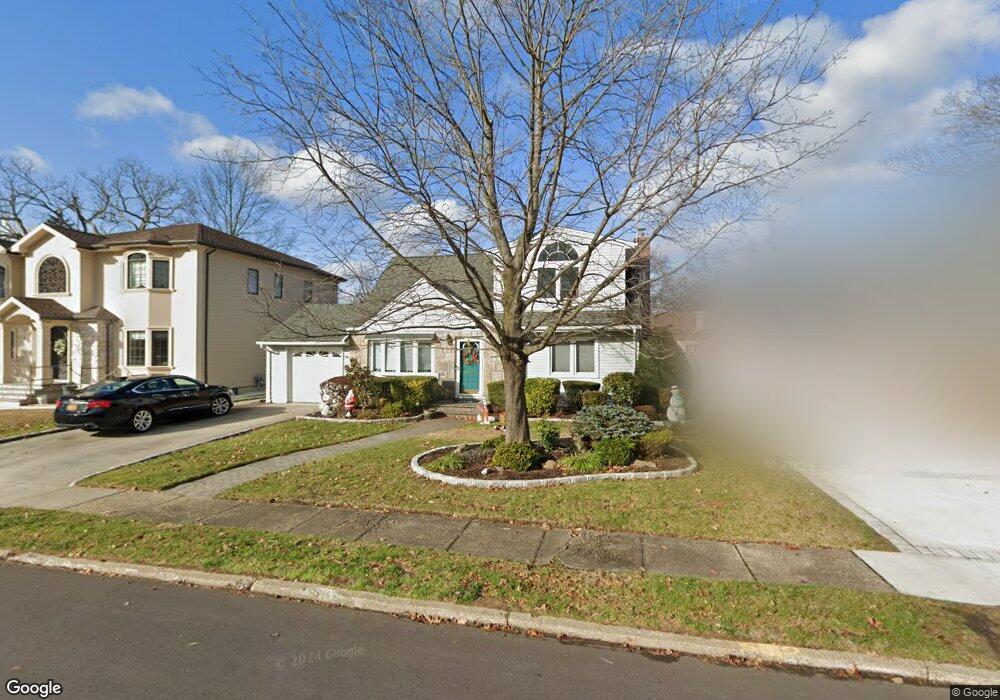
2043 Brian Dr Merrick, NY 11566
Estimated Value: $709,614 - $915,000
Studio
2
Baths
1,827
Sq Ft
$445/Sq Ft
Est. Value
About This Home
This home is located at 2043 Brian Dr, Merrick, NY 11566 and is currently estimated at $812,307, approximately $444 per square foot. 2043 Brian Dr is a home located in Nassau County with nearby schools including Merrick Avenue Middle School, Sanford H Calhoun High School, and Sacred Heart School.
Ownership History
Date
Name
Owned For
Owner Type
Purchase Details
Closed on
Jun 12, 2019
Sold by
Leach John E and Leach Susan M
Bought by
Leach Trust
Current Estimated Value
Purchase Details
Closed on
Jul 24, 1996
Sold by
Ferrizz Matthew and Ferrizz Lottie
Bought by
Leach John and Leach Susan
Home Financials for this Owner
Home Financials are based on the most recent Mortgage that was taken out on this home.
Original Mortgage
$100,000
Interest Rate
8.27%
Create a Home Valuation Report for This Property
The Home Valuation Report is an in-depth analysis detailing your home's value as well as a comparison with similar homes in the area
Home Values in the Area
Average Home Value in this Area
Purchase History
| Date | Buyer | Sale Price | Title Company |
|---|---|---|---|
| Leach Trust | -- | None Available | |
| Leach John | $175,000 | -- |
Source: Public Records
Mortgage History
| Date | Status | Borrower | Loan Amount |
|---|---|---|---|
| Previous Owner | Leach John | $100,000 |
Source: Public Records
Tax History
| Year | Tax Paid | Tax Assessment Tax Assessment Total Assessment is a certain percentage of the fair market value that is determined by local assessors to be the total taxable value of land and additions on the property. | Land | Improvement |
|---|---|---|---|---|
| 2025 | $14,044 | $519 | $195 | $324 |
| 2024 | $3,971 | $538 | $202 | $336 |
Source: Public Records
Map
Nearby Homes
- 37 Orchard St
- 25 Old Mill Rd
- 1531 Merrick Ave
- 204 Maeder Ave
- 2016 Abbot Ave
- 840 Jerusalem Ave
- 526 Park Ave
- 1415 Rhode Ave
- 1817 Gardenia Ave
- 20 Iris Ave
- 1563 Stevens Ave
- 2360 Hamilton Rd
- 45 Richard Ave
- 1526 Rhode Ave
- 1680 Lake Ave
- 1617 Richard Ave
- 1706 Old Mill Rd
- 1448 Dewey Ave
- 101 Northridge Ave
- TBD Camp Ave
Your Personal Tour Guide
Ask me questions while you tour the home.