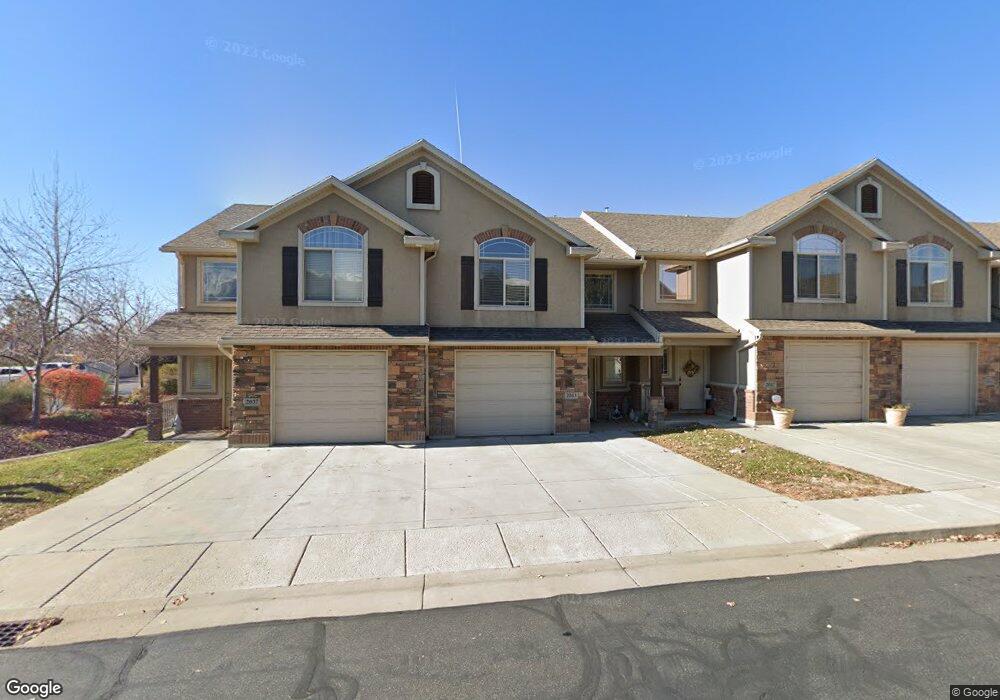
2043 Evans Cove Loop Layton, UT 84041
Estimated Value: $363,000 - $376,407
3
Beds
3
Baths
1,500
Sq Ft
$246/Sq Ft
Est. Value
About This Home
This home is located at 2043 Evans Cove Loop, Layton, UT 84041 and is currently estimated at $369,352, approximately $246 per square foot. 2043 Evans Cove Loop is a home located in Davis County with nearby schools including Lincoln Elementary School, North Layton Junior High School, and Northridge High School.
Ownership History
Date
Name
Owned For
Owner Type
Purchase Details
Closed on
Dec 30, 2011
Sold by
Gale Nicholas
Bought by
Blood Jennae
Current Estimated Value
Home Financials for this Owner
Home Financials are based on the most recent Mortgage that was taken out on this home.
Original Mortgage
$114,000
Outstanding Balance
$77,721
Interest Rate
3.94%
Mortgage Type
New Conventional
Estimated Equity
$291,631
Purchase Details
Closed on
Dec 3, 2008
Sold by
Ronnow Matthew J
Bought by
Gale Nicholas
Home Financials for this Owner
Home Financials are based on the most recent Mortgage that was taken out on this home.
Original Mortgage
$150,000
Interest Rate
6.04%
Mortgage Type
Purchase Money Mortgage
Purchase Details
Closed on
Mar 21, 2006
Sold by
Nilson & Co Inc
Bought by
Ronnow Matthew J
Home Financials for this Owner
Home Financials are based on the most recent Mortgage that was taken out on this home.
Original Mortgage
$29,596
Interest Rate
6.18%
Mortgage Type
Credit Line Revolving
Create a Home Valuation Report for This Property
The Home Valuation Report is an in-depth analysis detailing your home's value as well as a comparison with similar homes in the area
Home Values in the Area
Average Home Value in this Area
Purchase History
| Date | Buyer | Sale Price | Title Company |
|---|---|---|---|
| Blood Jennae | -- | American Preferred | |
| Blood Jennae | -- | American Preferred | |
| Gale Nicholas | -- | Lincoln Title Insurance Agen | |
| Gale Nicholas | -- | Lincoln Title Insurance Agen | |
| Ronnow Matthew J | -- | Bonneville Title Company | |
| Ronnow Matthew J | -- | Bonneville Title Company |
Source: Public Records
Mortgage History
| Date | Status | Borrower | Loan Amount |
|---|---|---|---|
| Open | Blood Jennae | $114,000 | |
| Previous Owner | Gale Nicholas | $150,000 | |
| Previous Owner | Ronnow Matthew J | $29,596 | |
| Previous Owner | Ronnow Matthew J | $118,382 |
Source: Public Records
Tax History
| Year | Tax Paid | Tax Assessment Tax Assessment Total Assessment is a certain percentage of the fair market value that is determined by local assessors to be the total taxable value of land and additions on the property. | Land | Improvement |
|---|---|---|---|---|
| 2025 | $1,745 | $183,150 | $68,200 | $114,950 |
| 2024 | $1,696 | $179,300 | $52,250 | $127,050 |
| 2023 | $1,765 | $180,950 | $50,050 | $130,900 |
| 2022 | $1,788 | $329,000 | $83,000 | $246,000 |
| 2021 | $1,636 | $247,000 | $69,000 | $178,000 |
| 2020 | $1,505 | $218,000 | $51,000 | $167,000 |
| 2019 | $1,495 | $212,000 | $49,000 | $163,000 |
| 2018 | $1,327 | $189,000 | $49,000 | $140,000 |
| 2016 | $1,131 | $83,105 | $26,950 | $56,155 |
| 2015 | $1,121 | $78,155 | $26,950 | $51,205 |
| 2014 | $1,124 | $80,121 | $18,333 | $61,788 |
| 2013 | -- | $83,068 | $15,400 | $67,668 |
Source: Public Records
Map
Nearby Homes
- 1908 N 200 W
- 1857 N 50 W
- 2214 N 450 W
- 14 W Belvedere Way
- 2234 N 450 W
- 2246 N 475 W
- 498 W 2200 N
- 506 W 2200 N
- 2186 N 525 W
- 2236 N 525 W
- 1683 N 250 W
- 2500 N Fort Ln Unit 212
- 2500 N Fort Ln Unit 244
- 2600 N Hill Field Rd Unit 134
- 2600 N Hill Field Rd Unit 4
- 1571 N 160 W
- 579 W 2350 N
- 621 Paul Ave
- 2149 N 750 W
- 227 E 1500 N
- 2043 Evans Cove Loop Unit 67
- 2047 Evans Cove Loop
- 2037 Evans Cove Loop
- 2037 Evans Cove Loop Unit 68
- 2051 Evans Cove Loop
- 2040 Evans Cove Loop
- 2040 Evans Cove Loop Unit 46
- 2038 Evans Cove Loop
- 2038 Evans Cove Loop Unit 45
- 2055 Evans Cove Loop
- 2055 Evans Cove Loop Unit 64
- 2046 Evans Cove Loop
- 2050 Evans Cove Loop
- 2050 Evans Cove Loop Unit 48
- 2059 Evans Cove Loop
- 2059 Evans Cove Loop Unit 32
- 2059 Evans Cove Loop Unit 63
- 2056 Evans Cove Loop
- 2042 Evans Cove Loop
- 2060 Evans Cove Loop
Your Personal Tour Guide
Ask me questions while you tour the home.