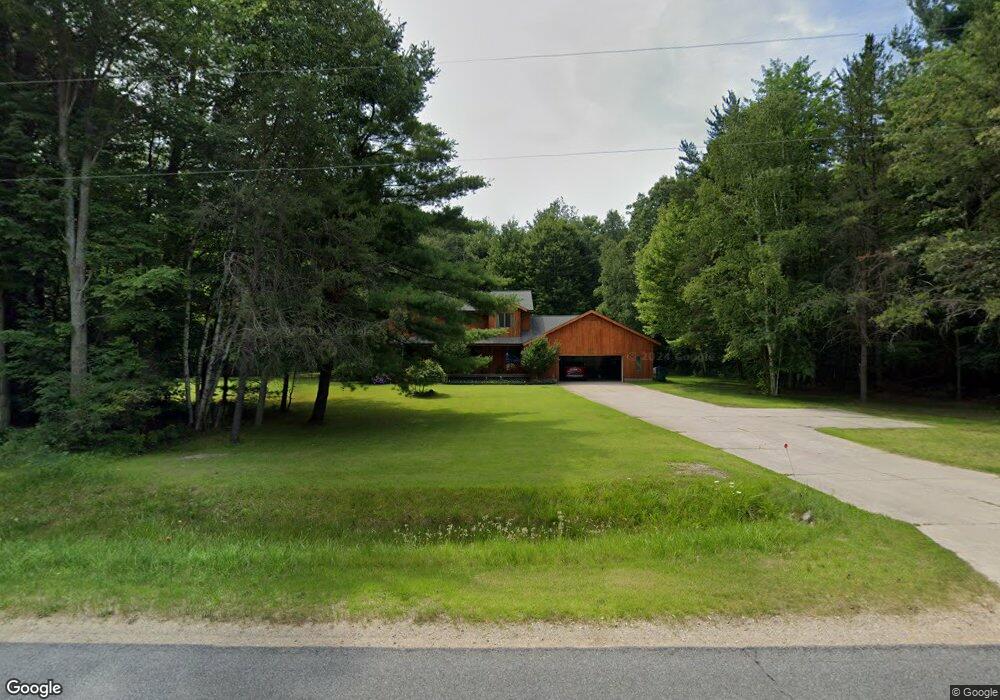
2043 N Green Creek Rd Muskegon, MI 49445
Estimated Value: $298,000 - $326,647
3
Beds
2
Baths
2,380
Sq Ft
$131/Sq Ft
Est. Value
About This Home
This home is located at 2043 N Green Creek Rd, Muskegon, MI 49445 and is currently estimated at $311,662, approximately $130 per square foot. 2043 N Green Creek Rd is a home located in Muskegon County with nearby schools including Reeths-Puffer High School.
Ownership History
Date
Name
Owned For
Owner Type
Purchase Details
Closed on
Dec 4, 2024
Sold by
Nelski John and Nelski Claudia D
Bought by
Nelski Family Protection Trust and Nelski
Current Estimated Value
Purchase Details
Closed on
Nov 21, 2024
Sold by
Kortering David Bruce and Verge Karyn Lynn
Bought by
Nelski John and Nelski Claudia D
Purchase Details
Closed on
May 15, 2017
Sold by
Nelski John E and Nelski Claudia D
Bought by
Nelski John E
Create a Home Valuation Report for This Property
The Home Valuation Report is an in-depth analysis detailing your home's value as well as a comparison with similar homes in the area
Home Values in the Area
Average Home Value in this Area
Purchase History
| Date | Buyer | Sale Price | Title Company |
|---|---|---|---|
| Nelski Family Protection Trust | -- | None Listed On Document | |
| Nelski Family Protection Trust | -- | None Listed On Document | |
| Nelski John | $2,600 | None Listed On Document | |
| Nelski John | $2,600 | None Listed On Document | |
| Nelski John E | -- | Attorney |
Source: Public Records
Tax History Compared to Growth
Tax History
| Year | Tax Paid | Tax Assessment Tax Assessment Total Assessment is a certain percentage of the fair market value that is determined by local assessors to be the total taxable value of land and additions on the property. | Land | Improvement |
|---|---|---|---|---|
| 2025 | $2,125 | $135,800 | $0 | $0 |
| 2024 | $764 | $133,400 | $0 | $0 |
| 2023 | $730 | $123,600 | $0 | $0 |
| 2022 | $1,934 | $100,200 | $0 | $0 |
| 2021 | $1,881 | $96,800 | $0 | $0 |
| 2020 | $1,862 | $93,000 | $0 | $0 |
| 2019 | $1,828 | $81,000 | $0 | $0 |
| 2018 | $1,807 | $77,900 | $0 | $0 |
| 2017 | $1,829 | $78,800 | $0 | $0 |
| 2016 | $623 | $59,200 | $0 | $0 |
| 2015 | -- | $59,500 | $0 | $0 |
| 2014 | -- | $56,900 | $0 | $0 |
| 2013 | -- | $55,300 | $0 | $0 |
Source: Public Records
Map
Nearby Homes
- V/L W River Rd
- 1641 N Buys Rd
- 0 N Weber Rd
- V/L W Giles Rd
- 2965 W Giles Rd
- 2055 Horton Rd
- 1515 W Addison Way Unit 28
- 1513 W Addison Way Unit 28
- 1516 W Addison Way Unit 54
- 1709 Hampstead Dr
- 1741 Hansen St
- 1898 Benjamin Rd
- 2855 Fenner Rd
- 3074 Fenner Rd
- 1596 Nottingham Ct
- 1310 W Giles Rd
- 3280 Fenner Rd
- 1234 W Giles Rd
- 780 Horton Rd
- 1045 Greenbriar Dr
- 2051 N Green Creek Rd
- 2037 N Green Creek Rd
- 1 N Green Creek Rd
- 00 N Green Creek Rd
- 2036 N Green Creek Rd
- 0 N Green Creek Rd Unit 71016049695
- 0 N Green Creek Rd Unit 71015028767
- 0 N Green Creek Rd Unit 71016061105
- 0 N Green Creek Rd Unit 71016061103
- 0 N Green Creek Rd Unit 71018016648
- 0 N Green Creek Rd Unit 71013067858
- 0 N Green Creek Rd Unit 71018018136
- 0 N Green Creek Rd Unit 71015007596
- 0 N Green Creek Rd Unit 71022006590
- 0 N Green Creek Rd Unit 22006590
- 0 N Green Creek Rd Unit M13043960
- 0 N Green Creek Rd Unit M13043828
- 0 N Green Creek Rd Unit M14046069
- 0 N Green Creek Rd Unit M15007596
- 0 N Green Creek Rd Unit M15028767