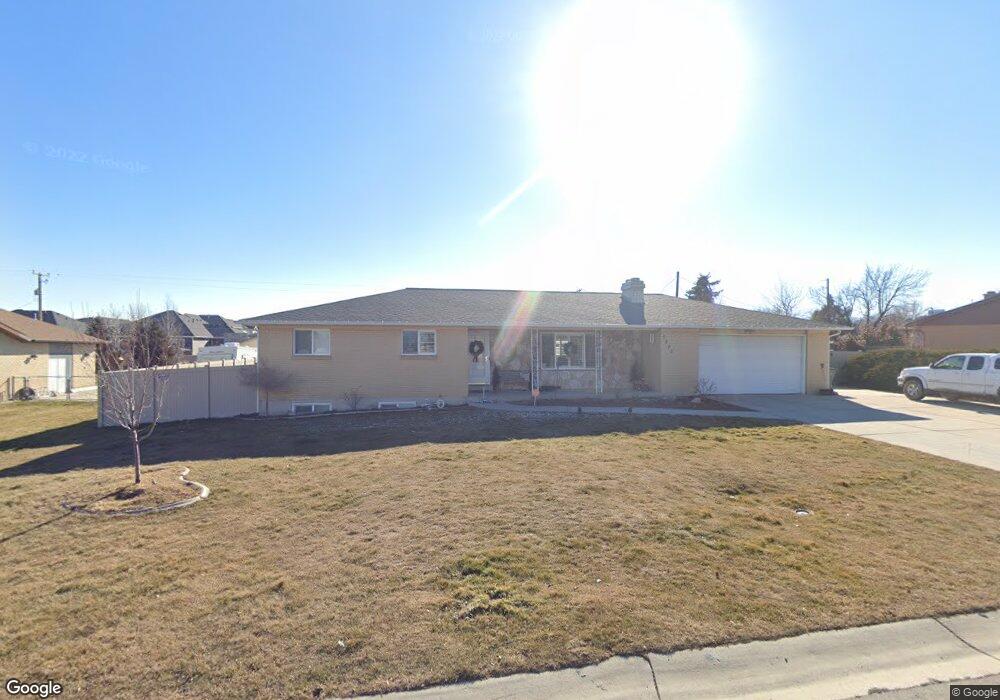
2043 W 9640 S South Jordan, UT 84095
Estimated Value: $664,000 - $735,000
5
Beds
3
Baths
3,056
Sq Ft
$225/Sq Ft
Est. Value
About This Home
This home is located at 2043 W 9640 S, South Jordan, UT 84095 and is currently estimated at $687,307, approximately $224 per square foot. 2043 W 9640 S is a home located in Salt Lake County with nearby schools including Jordan Ridge School, South Jordan Middle School, and Hawthorn Academy.
Ownership History
Date
Name
Owned For
Owner Type
Purchase Details
Closed on
Jan 7, 2019
Sold by
Carter Joseph D
Bought by
Carter Joseph D and Carter Margarita
Current Estimated Value
Home Financials for this Owner
Home Financials are based on the most recent Mortgage that was taken out on this home.
Original Mortgage
$357,000
Outstanding Balance
$312,401
Interest Rate
4.8%
Mortgage Type
New Conventional
Estimated Equity
$374,906
Purchase Details
Closed on
May 13, 2014
Sold by
Shepherd Steven L and Shepherd Wilma M
Bought by
Ballard Matthew R and Ballard Stephanie
Home Financials for this Owner
Home Financials are based on the most recent Mortgage that was taken out on this home.
Original Mortgage
$300,113
Interest Rate
3.75%
Mortgage Type
FHA
Purchase Details
Closed on
Dec 23, 2009
Sold by
Shepherd Steven L and Shepherd Wilma M
Bought by
Shepherd Steven L and Shepherd Wilma M
Create a Home Valuation Report for This Property
The Home Valuation Report is an in-depth analysis detailing your home's value as well as a comparison with similar homes in the area
Home Values in the Area
Average Home Value in this Area
Purchase History
| Date | Buyer | Sale Price | Title Company |
|---|---|---|---|
| Carter Joseph D | -- | Vanguard Title | |
| Carter Joseph D | -- | Vanguard Title Ins Agcy | |
| Ballard Stephanie | -- | Vanguard Title Ins Agcy | |
| Ballard Matthew R | -- | First American Title | |
| Shepherd Steven L | -- | None Available |
Source: Public Records
Mortgage History
| Date | Status | Borrower | Loan Amount |
|---|---|---|---|
| Open | Carter Joseph D | $357,000 | |
| Previous Owner | Ballard Matthew R | $300,113 |
Source: Public Records
Tax History Compared to Growth
Tax History
| Year | Tax Paid | Tax Assessment Tax Assessment Total Assessment is a certain percentage of the fair market value that is determined by local assessors to be the total taxable value of land and additions on the property. | Land | Improvement |
|---|---|---|---|---|
| 2025 | $3,078 | $612,500 | $237,400 | $375,100 |
| 2024 | $3,078 | $584,500 | $229,800 | $354,700 |
| 2023 | $3,130 | $560,700 | $216,800 | $343,900 |
| 2022 | $3,320 | $582,900 | $212,600 | $370,300 |
| 2021 | $2,700 | $435,000 | $142,700 | $292,300 |
| 2020 | $2,731 | $412,400 | $142,700 | $269,700 |
| 2019 | $2,363 | $350,700 | $134,600 | $216,100 |
| 2018 | $2,259 | $333,700 | $134,600 | $199,100 |
| 2017 | $2,070 | $299,600 | $134,600 | $165,000 |
| 2016 | $2,012 | $275,900 | $134,600 | $141,300 |
| 2015 | $1,949 | $259,900 | $171,900 | $88,000 |
| 2014 | $1,867 | $244,700 | $163,800 | $80,900 |
Source: Public Records
Map
Nearby Homes
- 9496 S 1930 W
- 1788 W Ikaros Ln
- 1767 W Ikaros Ln
- 2246 Country Bend Dr Unit 25
- 1741 W Nikos Ln
- 9414 S 1980 W
- 1718 W Thira Ln
- 2097 Jordan Villa Dr
- 1719 W Brocious Way Unit 301
- 1891 Orchard View Cir
- 9503 S Tirado Cove Unit 203
- 9511 S Tirado Cove Unit 204
- 1753 Rylie Ann Cir
- 1673 Peaceful Cir
- 2116 W Abbey View Rd
- 9635 S 1600 W
- 9252 S 2040 W Unit D
- 1968 W 9270 S Unit C
- 2177 W 9240 S
- 2439 Bridle Oak Dr
- 2021 W 9640 S
- 2061 W 9640 S
- 2054 W Arya Ct
- 2042 W Arya Ct
- 2066 W Arya Ct
- 2032 W Santorini Dr
- 2005 W 9640 S
- 2078 W Arya Ct
- 2077 W 9640 S
- 2018 W Santorini Dr
- 2054 W 9640 S
- 2074 W 9640 S
- 2049 W Arya Ct
- 2010 W 9640 S
- 1981 W 9640 S
- 2027 W Santorini Dr
- 9712 S Kamari Dr
- 2069 W Arya Ct
- 1994 W Santorini Dr
- 2009 W Santorini Dr