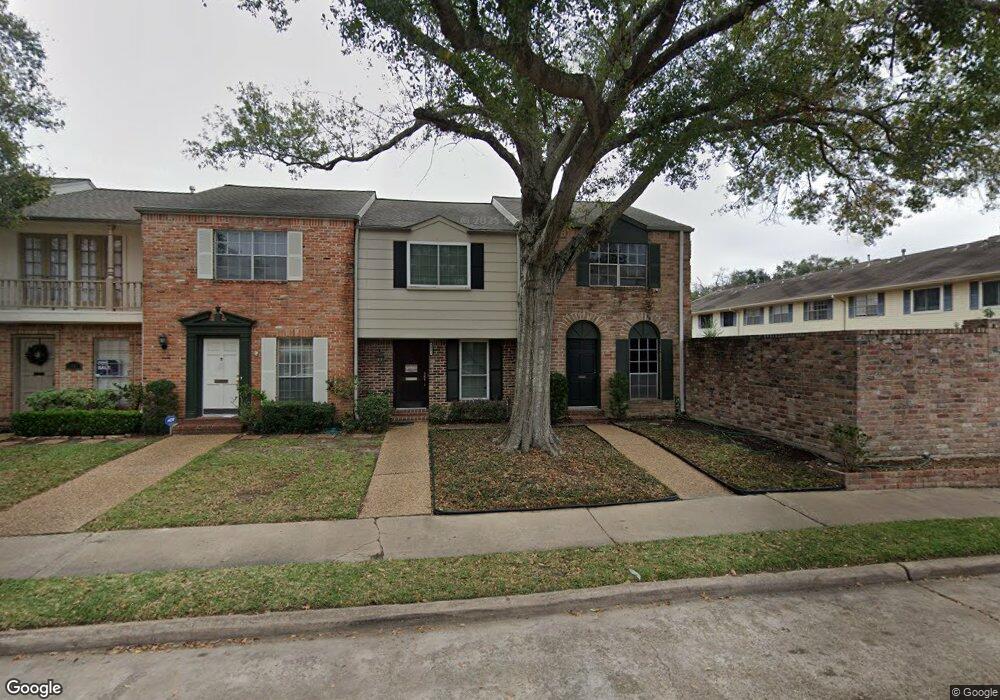
2043 Winrock Blvd Unit 156 Houston, TX 77057
Uptown-Galleria District NeighborhoodEstimated Value: $169,000 - $286,000
2
Beds
2
Baths
1,056
Sq Ft
$200/Sq Ft
Est. Value
About This Home
This home is located at 2043 Winrock Blvd Unit 156, Houston, TX 77057 and is currently estimated at $211,055, approximately $199 per square foot. 2043 Winrock Blvd Unit 156 is a home located in Harris County with nearby schools including Briargrove Elementary School, Tanglewood Middle, and Wisdom High School.
Ownership History
Date
Name
Owned For
Owner Type
Purchase Details
Closed on
Aug 21, 2015
Sold by
Steinway Andrea
Bought by
Knepper Allen Scott
Current Estimated Value
Home Financials for this Owner
Home Financials are based on the most recent Mortgage that was taken out on this home.
Original Mortgage
$173,375
Outstanding Balance
$136,590
Interest Rate
4.08%
Mortgage Type
New Conventional
Estimated Equity
$74,465
Purchase Details
Closed on
Jul 31, 2013
Sold by
Shell Allison Leigh and Vankoolwijk Martijn Q
Bought by
Steinway Andrew
Home Financials for this Owner
Home Financials are based on the most recent Mortgage that was taken out on this home.
Original Mortgage
$99,000
Interest Rate
4.34%
Mortgage Type
New Conventional
Purchase Details
Closed on
Mar 1, 2006
Sold by
Schneider Ann E
Bought by
Shell Allison Leigh
Home Financials for this Owner
Home Financials are based on the most recent Mortgage that was taken out on this home.
Original Mortgage
$50,000
Interest Rate
6.05%
Mortgage Type
Fannie Mae Freddie Mac
Create a Home Valuation Report for This Property
The Home Valuation Report is an in-depth analysis detailing your home's value as well as a comparison with similar homes in the area
Home Values in the Area
Average Home Value in this Area
Purchase History
| Date | Buyer | Sale Price | Title Company |
|---|---|---|---|
| Knepper Allen Scott | -- | None Available | |
| Steinway Andrew | -- | Chicago Title | |
| Shell Allison Leigh | -- | American Title Co |
Source: Public Records
Mortgage History
| Date | Status | Borrower | Loan Amount |
|---|---|---|---|
| Open | Knepper Allen Scott | $173,375 | |
| Previous Owner | Steinway Andrew | $99,000 | |
| Previous Owner | Shell Allison Leigh | $50,000 |
Source: Public Records
Tax History Compared to Growth
Tax History
| Year | Tax Paid | Tax Assessment Tax Assessment Total Assessment is a certain percentage of the fair market value that is determined by local assessors to be the total taxable value of land and additions on the property. | Land | Improvement |
|---|---|---|---|---|
| 2025 | $2,352 | $179,926 | $34,186 | $145,740 |
| 2024 | $2,352 | $194,021 | $36,864 | $157,157 |
| 2023 | $2,352 | $174,591 | $33,172 | $141,419 |
| 2022 | $3,705 | $168,260 | $31,969 | $136,291 |
| 2021 | $3,715 | $159,406 | $30,287 | $129,119 |
| 2020 | $4,098 | $169,217 | $32,151 | $137,066 |
| 2019 | $4,282 | $169,217 | $32,151 | $137,066 |
| 2018 | $3,360 | $180,000 | $36,946 | $143,054 |
| 2017 | $4,551 | $180,000 | $36,946 | $143,054 |
| 2016 | $4,554 | $180,114 | $34,222 | $145,892 |
| 2015 | -- | $159,308 | $30,269 | $129,039 |
| 2014 | -- | $135,001 | $25,650 | $109,351 |
Source: Public Records
Map
Nearby Homes
- 6339 Briar Rose Dr Unit 144
- 6350 Briar Rose Dr Unit 185
- 2065 Winrock Blvd Unit 55
- 2059 Winrock Blvd Unit 52
- 2011 Winrock Blvd Unit 172
- 6354 Del Monte Dr Unit 87
- 6335 Del Monte Dr Unit 97
- 6402 Del Monte Dr Unit 45
- 6402 Del Monte Dr Unit 65
- 6410 Del Monte Dr Unit 102
- 6402 Del Monte Dr Unit 76
- 2137 Winrock Blvd Unit 26
- 1901 S Voss Rd Unit 33
- 6430 Olympia Dr Unit 91
- 6442 Olympia Dr Unit 85
- 6481 Olympia Dr Unit 74
- 6427 Olympia Dr Unit 114
- 12 Jaime Nuno
- 6467 Olympia Dr Unit 61
- 6206 San Felipe St
- 2041 Winrock Blvd Unit 157
- 2029 Winrock Blvd Unit 163
- 2039 Winrock Blvd Unit 158
- 2027 Winrock Blvd Unit 164
- 2055 Winrock Blvd Unit 57
- 2053 Winrock Blvd Unit 58
- 2037 Winrock Blvd Unit 159
- 2025 Winrock Blvd Unit 165
- 2051 Winrock Blvd Unit 59
- 2035 Winrock Blvd Unit 160
- 2049 Winrock Blvd Unit 60
- 2045 Winrock Blvd Unit 62
- 2023 Winrock Blvd Unit 166
- 2033 Winrock Blvd Unit 161
- 2047 Winrock Blvd Unit 61
- 6351 Briar Rose Dr Unit 149
- 6349 Briar Rose Dr Unit 148
- 6353 Briar Rose Dr Unit 150
- 2031 Winrock Blvd Unit 162
- 2057 Winrock Blvd Unit 51