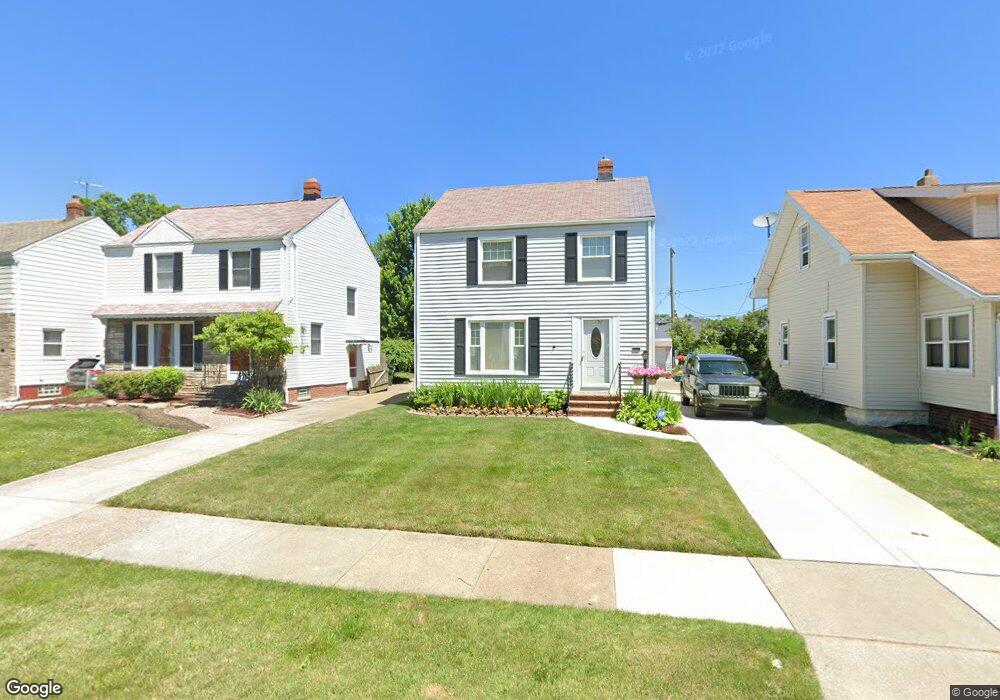
20431 Tracy Ave Euclid, OH 44123
Estimated Value: $117,846 - $184,000
3
Beds
1
Bath
1,100
Sq Ft
$127/Sq Ft
Est. Value
About This Home
This home is located at 20431 Tracy Ave, Euclid, OH 44123 and is currently estimated at $139,712, approximately $127 per square foot. 20431 Tracy Ave is a home located in Cuyahoga County with nearby schools including Arbor Elementary School, Euclid Middle School, and Euclid High School.
Ownership History
Date
Name
Owned For
Owner Type
Purchase Details
Closed on
Oct 13, 2004
Sold by
Sincich Mark John and Petrey Andrea
Bought by
Dehnert Bernadette A
Current Estimated Value
Home Financials for this Owner
Home Financials are based on the most recent Mortgage that was taken out on this home.
Original Mortgage
$111,055
Outstanding Balance
$55,442
Interest Rate
5.89%
Mortgage Type
Purchase Money Mortgage
Estimated Equity
$84,270
Purchase Details
Closed on
Mar 29, 1999
Sold by
Sincich Mark John
Bought by
Sincich Mark John and Petrey Andrea
Purchase Details
Closed on
Oct 8, 1992
Sold by
Sincich Mark John
Bought by
Sincich Mark John
Purchase Details
Closed on
Aug 14, 1989
Sold by
Zaller Daniel A and Zaller Regina A
Bought by
Sincich Mark John
Purchase Details
Closed on
Aug 26, 1983
Sold by
Green Ellen
Bought by
Zaller Daniel A and Zaller Regina A
Purchase Details
Closed on
Jan 1, 1975
Bought by
Green Ellen
Create a Home Valuation Report for This Property
The Home Valuation Report is an in-depth analysis detailing your home's value as well as a comparison with similar homes in the area
Home Values in the Area
Average Home Value in this Area
Purchase History
| Date | Buyer | Sale Price | Title Company |
|---|---|---|---|
| Dehnert Bernadette A | $116,900 | Executive Title Agency | |
| Sincich Mark John | -- | Reliance Title | |
| Sincich Mark John | -- | -- | |
| Sincich Mark John | $63,900 | -- | |
| Zaller Daniel A | $49,000 | -- | |
| Green Ellen | -- | -- |
Source: Public Records
Mortgage History
| Date | Status | Borrower | Loan Amount |
|---|---|---|---|
| Open | Dehnert Bernadette A | $111,055 |
Source: Public Records
Tax History Compared to Growth
Tax History
| Year | Tax Paid | Tax Assessment Tax Assessment Total Assessment is a certain percentage of the fair market value that is determined by local assessors to be the total taxable value of land and additions on the property. | Land | Improvement |
|---|---|---|---|---|
| 2024 | $2,831 | $40,985 | $7,875 | $33,110 |
| 2023 | $2,193 | $24,960 | $6,200 | $18,760 |
| 2022 | $2,144 | $24,960 | $6,200 | $18,760 |
| 2021 | $2,380 | $24,960 | $6,200 | $18,760 |
| 2020 | $2,004 | $18,900 | $4,690 | $14,210 |
| 2019 | $1,798 | $54,000 | $13,400 | $40,600 |
| 2018 | $1,766 | $18,900 | $4,690 | $14,210 |
| 2017 | $1,860 | $16,180 | $3,120 | $13,060 |
| 2016 | $1,864 | $16,180 | $3,120 | $13,060 |
| 2015 | $1,701 | $16,180 | $3,120 | $13,060 |
| 2014 | $1,701 | $16,180 | $3,120 | $13,060 |
Source: Public Records
Map
Nearby Homes
- 20590 Morris Ave
- 20571 Naumann Ave
- 20800 Morris Ave
- 20801 Morris Ave
- 20830 Tracy Ave
- 20561 Westport Ave
- 20760 Westport Ave
- 21051 Nicholas Ave
- 20921 Westport Ave
- 20540 Fuller Ave
- 21051 Westport Ave
- 311 E 197th St
- 21170 Wilmore Ave
- 21050 Fuller Ave
- 21181 Ball Ave
- 21331 Morris Ave
- 19400 Meredith Ave
- 19450 Naumann Ave
- 21030 Priday Ave
- 19330 Meredith Ave
- 20451 Tracy Ave
- 20401 Tracy Ave
- 20471 Tracy Ave
- 20371 Tracy Ave
- 20351 Tracy Ave
- 20430 Morris Ave
- 20450 Morris Ave
- 20501 Tracy Ave
- 20470 Morris Ave
- 20400 Morris Ave
- 20331 Tracy Ave
- 20370 Morris Ave
- 20531 Tracy Ave
- 20430 Tracy Ave
- 20400 Tracy Ave
- 20450 Tracy Ave
- 20530 Morris Ave
- 20470 Tracy Ave
- 20370 Tracy Ave
- 20350 Morris Ave