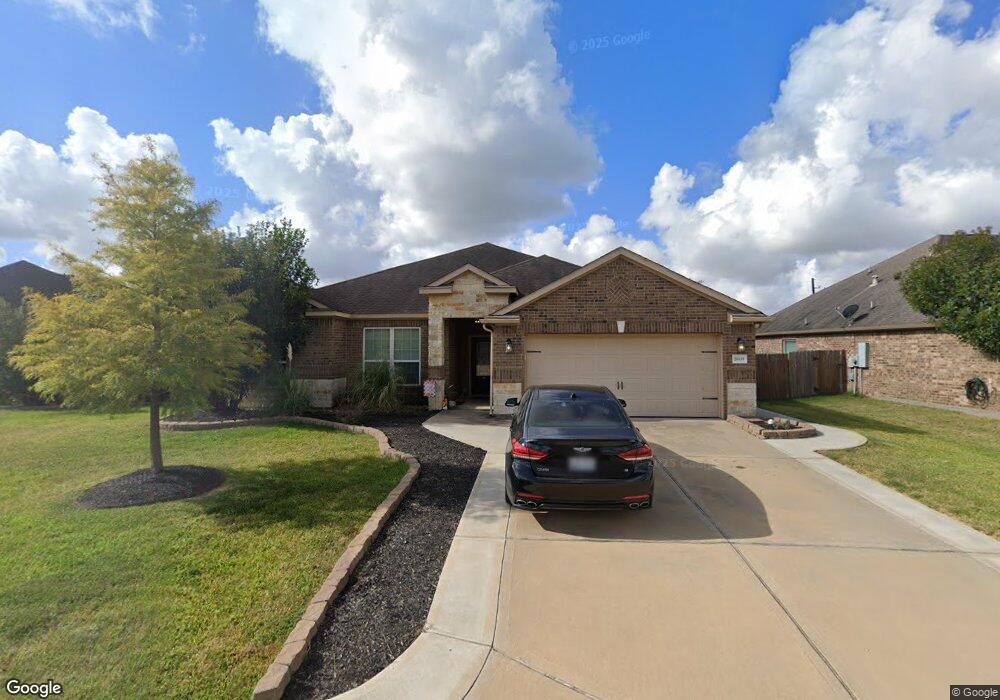
20439 Barrel Run Dr Hockley, TX 77447
Hockley NeighborhoodEstimated Value: $317,000 - $331,000
4
Beds
2
Baths
2,124
Sq Ft
$152/Sq Ft
Est. Value
About This Home
This home is located at 20439 Barrel Run Dr, Hockley, TX 77447 and is currently estimated at $323,076, approximately $152 per square foot. 20439 Barrel Run Dr is a home located in Harris County with nearby schools including Evelyn Turlington Elementary School, Schultz Junior High School, and Waller High School.
Ownership History
Date
Name
Owned For
Owner Type
Purchase Details
Closed on
Mar 14, 2022
Sold by
Maszurkewicz and Juliana
Bought by
Dailey Sherwood V
Current Estimated Value
Home Financials for this Owner
Home Financials are based on the most recent Mortgage that was taken out on this home.
Original Mortgage
$329,000
Outstanding Balance
$307,149
Interest Rate
3.85%
Mortgage Type
VA
Estimated Equity
$15,927
Purchase Details
Closed on
Jun 30, 2015
Sold by
Lgi Homes Texas Llc
Bought by
Maszurkewicz Justin and Maszurkewicz Juliana
Home Financials for this Owner
Home Financials are based on the most recent Mortgage that was taken out on this home.
Original Mortgage
$217,880
Interest Rate
4.75%
Mortgage Type
FHA
Create a Home Valuation Report for This Property
The Home Valuation Report is an in-depth analysis detailing your home's value as well as a comparison with similar homes in the area
Home Values in the Area
Average Home Value in this Area
Purchase History
| Date | Buyer | Sale Price | Title Company |
|---|---|---|---|
| Dailey Sherwood V | -- | Stewart Title | |
| Maszurkewicz Justin | -- | Texas American Title Co |
Source: Public Records
Mortgage History
| Date | Status | Borrower | Loan Amount |
|---|---|---|---|
| Open | Dailey Sherwood V | $329,000 | |
| Previous Owner | Maszurkewicz Justin | $217,880 |
Source: Public Records
Tax History Compared to Growth
Tax History
| Year | Tax Paid | Tax Assessment Tax Assessment Total Assessment is a certain percentage of the fair market value that is determined by local assessors to be the total taxable value of land and additions on the property. | Land | Improvement |
|---|---|---|---|---|
| 2025 | -- | $315,820 | $59,158 | $256,662 |
| 2024 | -- | $314,457 | $59,158 | $255,299 |
| 2023 | $7,358 | $355,685 | $59,158 | $296,527 |
| 2022 | $7,259 | $319,683 | $45,200 | $274,483 |
| 2021 | $6,828 | $239,090 | $41,544 | $197,546 |
| 2020 | $6,632 | $224,302 | $41,544 | $182,758 |
| 2019 | $7,187 | $236,001 | $36,559 | $199,442 |
| 2018 | $1,633 | $230,650 | $33,235 | $197,415 |
| 2017 | $6,931 | $230,650 | $33,235 | $197,415 |
| 2016 | $5,053 | $226,053 | $32,075 | $193,978 |
| 2015 | -- | $32,075 | $32,075 | $0 |
Source: Public Records
Map
Nearby Homes
- 20418 Barrel Run Dr
- 20434 Barrel Run Dr
- 20446 Barrel Run Dr
- 20414 Penny Blume Dr
- 20331 Penny Blume Dr
- 22603 August Crow Dr
- 22803 Gentle Shadow Dr
- 20619 Stout Dr
- 20611 Bauer Moonlight Dr
- 22619 Guncotton Ave
- 22511 Mount Echo Dr
- 22706 Tabberts Way
- 22702 Tabberts Way
- 20819 Mount Bauer Dr
- 20710 Hallow Cane Dr
- 22703 Threefold Ridge Dr
- 19902 Thurlow Ln
- 20818 Bastion Settle Dr
- 20822 Bastion Settle Dr
- 22526 Threefold Ridge Dr
- 20439 Barrel Run Dr
- 20447 Barrel Run Dr
- 20431 Barrel Run Dr
- 20431 Barrel Run Dr
- 20427 Barrel Run Dr
- 20451 Barrel Run Dr
- 20414 Bauer Rd
- 20423 Barrel Run Dr
- 20423 Barrel Run Dr
- 20442 Barrel Run Dr
- 20450 Barrel Run Dr
- 20438 Barrel Run Dr
- 20430 Barrel Run Dr
- 20419 Barrel Run Dr
- 20503 Parazetta Place
- 20426 Barrel Run Dr
- 22811 Sylvanus Dr
- 20415 Barrel Run Dr
- 22807 Sylvanus Dr
- 20507 Parazetta Place