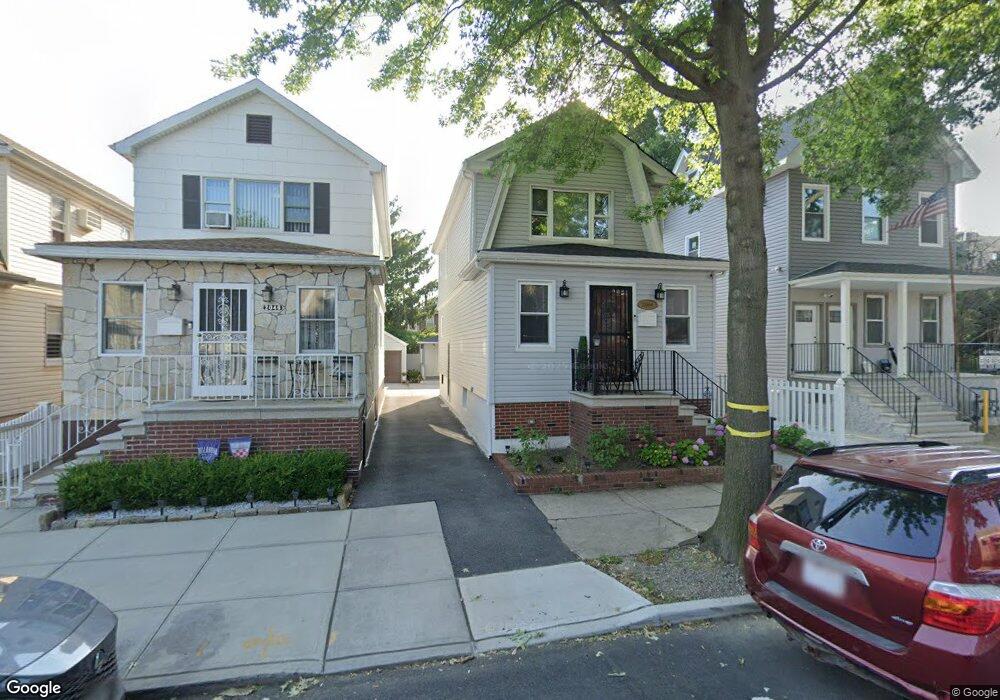
2044 Saint Paul Ave Bronx, NY 10461
Middletown-Pelham Bay NeighborhoodEstimated Value: $652,000 - $753,000
3
Beds
1
Bath
1,280
Sq Ft
$548/Sq Ft
Est. Value
About This Home
This home is located at 2044 Saint Paul Ave, Bronx, NY 10461 and is currently estimated at $701,449, approximately $548 per square foot. 2044 Saint Paul Ave is a home located in Bronx County with nearby schools including P.S. 71 Rose E Scala, Herbert H Lehman High School, and Icahn Charter School 3.
Ownership History
Date
Name
Owned For
Owner Type
Purchase Details
Closed on
Jan 20, 2017
Sold by
Torres Alberto Esq
Bought by
Pena Gilberto
Current Estimated Value
Purchase Details
Closed on
Apr 10, 2014
Sold by
Frias Francisco and Frias Jacqueline
Bought by
St Paul Ave Ii Inc and Pob 190313
Purchase Details
Closed on
Jul 23, 2004
Sold by
Frias Francisco
Bought by
Frias Francisco and Frias Jacqueline
Home Financials for this Owner
Home Financials are based on the most recent Mortgage that was taken out on this home.
Original Mortgage
$248,000
Interest Rate
6.08%
Mortgage Type
Purchase Money Mortgage
Purchase Details
Closed on
May 11, 1998
Sold by
Piro Michael J and Piro Jeanne
Bought by
Frias Francisco
Home Financials for this Owner
Home Financials are based on the most recent Mortgage that was taken out on this home.
Original Mortgage
$147,250
Interest Rate
6.98%
Create a Home Valuation Report for This Property
The Home Valuation Report is an in-depth analysis detailing your home's value as well as a comparison with similar homes in the area
Home Values in the Area
Average Home Value in this Area
Purchase History
| Date | Buyer | Sale Price | Title Company |
|---|---|---|---|
| Pena Gilberto | $355,000 | -- | |
| Pena Gilberto | $355,000 | -- | |
| St Paul Ave Ii Inc | $465,000 | -- | |
| St Paul Ave Ii Inc | $465,000 | -- | |
| Frias Francisco | -- | -- | |
| Frias Francisco | -- | -- | |
| Frias Francisco | $155,000 | The Judicial Title Ins Agenc | |
| Frias Francisco | $155,000 | The Judicial Title Ins Agenc |
Source: Public Records
Mortgage History
| Date | Status | Borrower | Loan Amount |
|---|---|---|---|
| Previous Owner | Frias Francisco | $248,000 | |
| Previous Owner | Frias Francisco | $147,250 |
Source: Public Records
Tax History Compared to Growth
Tax History
| Year | Tax Paid | Tax Assessment Tax Assessment Total Assessment is a certain percentage of the fair market value that is determined by local assessors to be the total taxable value of land and additions on the property. | Land | Improvement |
|---|---|---|---|---|
| 2025 | $5,657 | $29,856 | $5,563 | $24,293 |
| 2024 | $5,657 | $28,166 | $6,254 | $21,912 |
| 2023 | $5,703 | $28,080 | $5,852 | $22,228 |
| 2022 | $5,527 | $35,640 | $8,340 | $27,300 |
| 2021 | $5,550 | $34,200 | $8,340 | $25,860 |
| 2020 | $5,266 | $33,900 | $8,340 | $25,560 |
| 2019 | $4,910 | $32,040 | $8,340 | $23,700 |
| 2018 | $4,770 | $23,400 | $7,359 | $16,041 |
| 2017 | $4,623 | $22,680 | $8,001 | $14,679 |
| 2016 | $4,393 | $21,976 | $7,580 | $14,396 |
| 2015 | $2,361 | $20,733 | $8,219 | $12,514 |
| 2014 | $2,361 | $19,560 | $9,300 | $10,260 |
Source: Public Records
Map
Nearby Homes
- 1910 Pelham Pkwy S Unit 5C
- 1874 Pelham Pkwy S Unit 6M
- 1874 Pelham Pkwy S Unit 5B
- 1874 Pelham Pkwy S Unit 6E
- 1874 Pelham Pkwy S Unit 4R
- 2015 Saint Paul Ave Unit 3H
- 2015 St Paul Ave Unit 3G
- 2015 Saint Paul Ave Unit 6B
- 2024 Continental Ave
- 2032 Hobart Ave
- 2010 Hobart Ave
- 2887 E 194th St
- 2871 E 194th St
- 2849 E 195th St
- 1950 Pilgrim Ave
- 2884 Saint Theresa Ave
- 2211 de Reimer Ave
- 2201 Palmer Ave
- 1926 Hutchinson River Pkwy E Unit E
- 2225 Boller Ave
- 2044 St Paul Ave
- 2046 Saint Paul Ave
- 2042 Saint Paul Ave
- 2048 Saint Paul Ave
- 2050 Saint Paul Ave
- 2052 Saint Paul Ave
- 2032 Saint Paul Ave
- 2041 Colonial Ave
- 2045 Colonial Ave
- 2039 Colonial Ave Unit 10
- 2054 Saint Paul Ave
- 2037 Colonial Ave
- 2049 Colonial Ave
- 2033 Colonial Ave
- 2045 Saint Paul Ave
- 2043 Saint Paul Ave
- 2047 Saint Paul Ave
- 2041 Saint Paul Ave
- 2031 Colonial Ave
- 2954 E 196th St