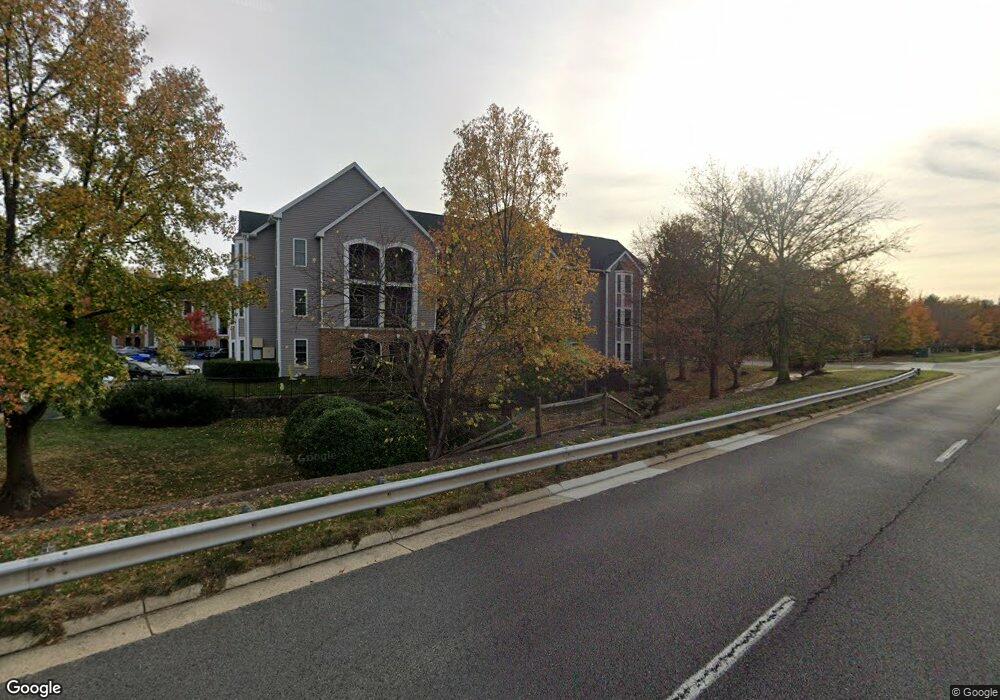
20445 Chesapeake Square Unit 302 Sterling, VA 20165
Estimated Value: $367,377 - $627,000
2
Beds
2
Baths
1,008
Sq Ft
$435/Sq Ft
Est. Value
About This Home
This home is located at 20445 Chesapeake Square Unit 302, Sterling, VA 20165 and is currently estimated at $438,594, approximately $435 per square foot. 20445 Chesapeake Square Unit 302 is a home located in Loudoun County with nearby schools including Potowmack Elementary School, River Bend Middle School, and Potomac Falls High School.
Ownership History
Date
Name
Owned For
Owner Type
Purchase Details
Closed on
Aug 24, 2007
Sold by
Smith Stacey L
Bought by
Ohumay Stephen
Current Estimated Value
Home Financials for this Owner
Home Financials are based on the most recent Mortgage that was taken out on this home.
Original Mortgage
$243,200
Outstanding Balance
$154,924
Interest Rate
6.78%
Mortgage Type
New Conventional
Estimated Equity
$283,670
Purchase Details
Closed on
Dec 1, 2003
Sold by
Thompson Charles A
Bought by
Smith Stacey L
Home Financials for this Owner
Home Financials are based on the most recent Mortgage that was taken out on this home.
Original Mortgage
$210,950
Interest Rate
6.09%
Mortgage Type
New Conventional
Purchase Details
Closed on
Mar 5, 1997
Sold by
Potomac Housing Assoc Lp
Bought by
Cross Gregory M
Home Financials for this Owner
Home Financials are based on the most recent Mortgage that was taken out on this home.
Original Mortgage
$105,850
Interest Rate
7.77%
Mortgage Type
FHA
Create a Home Valuation Report for This Property
The Home Valuation Report is an in-depth analysis detailing your home's value as well as a comparison with similar homes in the area
Home Values in the Area
Average Home Value in this Area
Purchase History
| Date | Buyer | Sale Price | Title Company |
|---|---|---|---|
| Ohumay Stephen | $256,000 | -- | |
| Smith Stacey L | $217,500 | -- | |
| Cross Gregory M | $108,900 | Island Title Corp |
Source: Public Records
Mortgage History
| Date | Status | Borrower | Loan Amount |
|---|---|---|---|
| Open | Ohumay Stephen | $243,200 | |
| Previous Owner | Smith Stacey L | $210,950 | |
| Previous Owner | Cross Gregory M | $105,850 |
Source: Public Records
Tax History Compared to Growth
Tax History
| Year | Tax Paid | Tax Assessment Tax Assessment Total Assessment is a certain percentage of the fair market value that is determined by local assessors to be the total taxable value of land and additions on the property. | Land | Improvement |
|---|---|---|---|---|
| 2025 | $2,816 | $349,840 | $115,000 | $234,840 |
| 2024 | $2,939 | $339,760 | $115,000 | $224,760 |
| 2023 | $2,752 | $314,560 | $115,000 | $199,560 |
| 2022 | $2,622 | $294,560 | $95,000 | $199,560 |
| 2021 | $2,662 | $271,630 | $75,000 | $196,630 |
| 2020 | $2,531 | $244,540 | $60,000 | $184,540 |
| 2019 | $2,556 | $244,550 | $60,000 | $184,550 |
| 2018 | $2,610 | $240,540 | $60,000 | $180,540 |
| 2017 | $2,525 | $224,420 | $60,000 | $164,420 |
| 2016 | $2,547 | $222,420 | $0 | $0 |
| 2015 | $2,525 | $162,430 | $0 | $162,430 |
| 2014 | $2,569 | $162,440 | $0 | $162,440 |
Source: Public Records
Map
Nearby Homes
- 46606 Drysdale Terrace Unit 101
- 20419 Riverbend Square Unit 200
- 46526 Cedarhurst Dr
- 46675 Cavendish Square
- 20597 Glenmere Square
- 20687 Smithfield Ct
- 46809 Trailwood Place
- 20627 Cutwater Place
- 86 Sugarland Run Dr
- 105 Woodgate Ct
- 203 Greenfield Ct
- 25 Jefferson Dr
- 126 Hillsdale Dr
- 46212 Wales Terrace
- 100 Marcum Ct
- 26 Carousel Ct
- 23 Monarch Dr
- 500 Giles Place
- 502 Giles Place
- 46134 Brisbane Square
- 20445 Chesapeake Square Unit 300
- 20445 Chesapeake Square Unit 102
- 20445 Chesapeake Square Unit 301
- 20445 Chesapeake Square Unit 203
- 20445 Chesapeake Square Unit 201
- 20445 Chesapeake Square Unit 202
- 20445 Chesapeake Square Unit 303
- 20445 Chesapeake Square Unit 101
- 20445 Chesapeake Square Unit 100
- 20445 Chesapeake Square Unit 200
- 20445 Chesapeake Square Unit 103
- 20447 Chesapeake Square Unit 20447 Chesapeake Sq
- 20447 Chesapeake Square Unit 301
- 20447 Chesapeake Square Unit 203
- 20447 Chesapeake Square Unit 100
- 20447 Chesapeake Square Unit 101
- 20447 Chesapeake Square Unit 302
- 20447 Chesapeake Square Unit 300
- 20447 Chesapeake Square Unit 201
- 20447 Chesapeake Square Unit 102