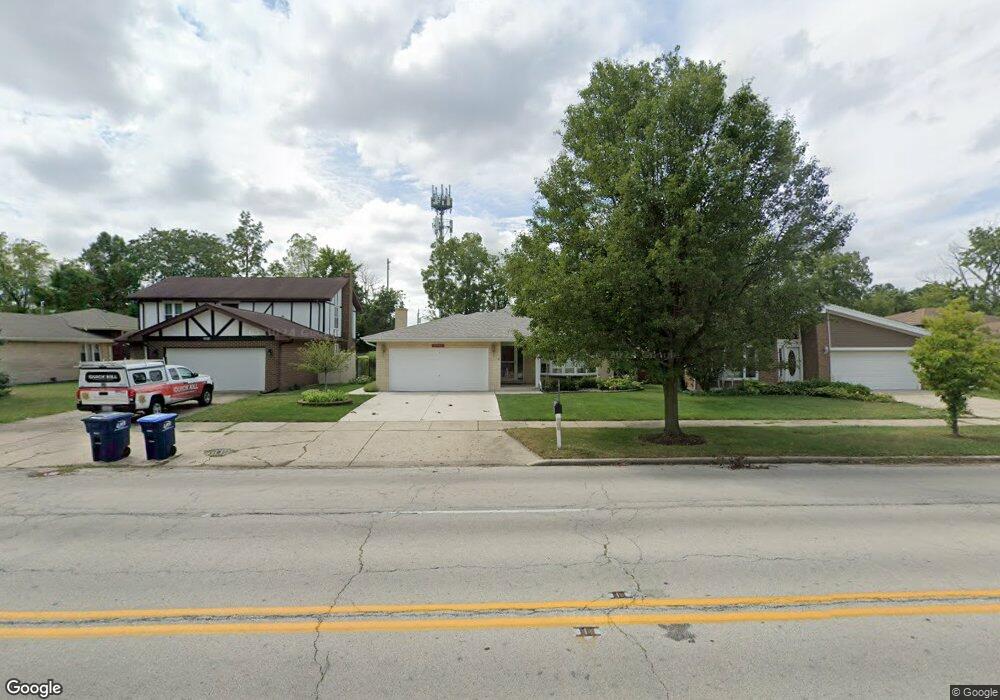
2045 Busse Hwy Des Plaines, IL 60016
Estimated Value: $451,000 - $545,000
3
Beds
3
Baths
1,890
Sq Ft
$261/Sq Ft
Est. Value
About This Home
This home is located at 2045 Busse Hwy, Des Plaines, IL 60016 and is currently estimated at $494,102, approximately $261 per square foot. 2045 Busse Hwy is a home located in Cook County with nearby schools including North Elementary School, Chippewa Middle School, and Maine East High School.
Ownership History
Date
Name
Owned For
Owner Type
Purchase Details
Closed on
Jul 31, 2023
Sold by
Baushke Susan K
Bought by
Susan K Baushke 2008 Trust and Baushke
Current Estimated Value
Purchase Details
Closed on
Aug 17, 1998
Sold by
Flannery Robert and Flannery Diane
Bought by
Arvanites Steven and Baushke Susan K
Home Financials for this Owner
Home Financials are based on the most recent Mortgage that was taken out on this home.
Original Mortgage
$176,000
Interest Rate
7.03%
Create a Home Valuation Report for This Property
The Home Valuation Report is an in-depth analysis detailing your home's value as well as a comparison with similar homes in the area
Home Values in the Area
Average Home Value in this Area
Purchase History
| Date | Buyer | Sale Price | Title Company |
|---|---|---|---|
| Susan K Baushke 2008 Trust | -- | None Listed On Document | |
| Arvanites Steven | $220,000 | -- |
Source: Public Records
Mortgage History
| Date | Status | Borrower | Loan Amount |
|---|---|---|---|
| Previous Owner | Arvanites Steven | $176,000 |
Source: Public Records
Tax History Compared to Growth
Tax History
| Year | Tax Paid | Tax Assessment Tax Assessment Total Assessment is a certain percentage of the fair market value that is determined by local assessors to be the total taxable value of land and additions on the property. | Land | Improvement |
|---|---|---|---|---|
| 2024 | $8,262 | $34,650 | $5,775 | $28,875 |
| 2023 | $8,036 | $34,650 | $5,775 | $28,875 |
| 2022 | $8,036 | $34,650 | $5,775 | $28,875 |
| 2021 | $6,680 | $25,062 | $7,012 | $18,050 |
| 2020 | $6,636 | $25,062 | $7,012 | $18,050 |
| 2019 | $7,615 | $31,725 | $7,012 | $24,713 |
| 2018 | $8,386 | $31,476 | $6,187 | $25,289 |
| 2017 | $8,255 | $31,476 | $6,187 | $25,289 |
| 2016 | $8,053 | $31,476 | $6,187 | $25,289 |
| 2015 | $8,079 | $29,348 | $5,362 | $23,986 |
| 2014 | $7,925 | $29,348 | $5,362 | $23,986 |
| 2013 | $7,710 | $29,348 | $5,362 | $23,986 |
Source: Public Records
Map
Nearby Homes
- 2015 Busse Hwy
- 1010 Crabtree Ln
- 980 Apple Creek Ln
- 1812 E Algonquin Rd
- 1278 E River Dr
- 1705 Pavilion Way Unit 303
- 1715 Pavilion Way Unit 205
- 1745 Pavilion Way Unit 502
- 1735 Park Ridge Point
- 960 S River Rd Unit 208
- 1600 E Thacker St Unit 706
- 1316 N Northwest Hwy
- 711 S River Rd Unit 401
- 1524 Oakwood Ave
- 1675 Mill St Unit 302
- 1640 S River Rd
- 1488 Van Buren Ave
- 650 S River Rd Unit 306
- 1491 Ashland Ave Unit 3NW
- 1486 Van Buren Ave
- 2051 Busse Hwy
- 2039 Busse Hwy
- 2057 Busse Hwy
- 2033 Busse Hwy
- 2063 Busse Hwy
- 2027 Busse Hwy
- 2069 Busse Hwy
- 2060 Busse Hwy
- 2075 Busse Hwy
- 2108 Busse Hwy
- 2009 Busse Hwy
- 2081 Busse Hwy
- 2070 Busse Hwy
- 2003 Busse Hwy
- 1053 Apple Creek Ln
- 2087 Busse Hwy
- 1043 Apple Creek Ln
- 1043 Apple Creek Ln
- 2040 Busse Hwy
- 1997 Busse Hwy