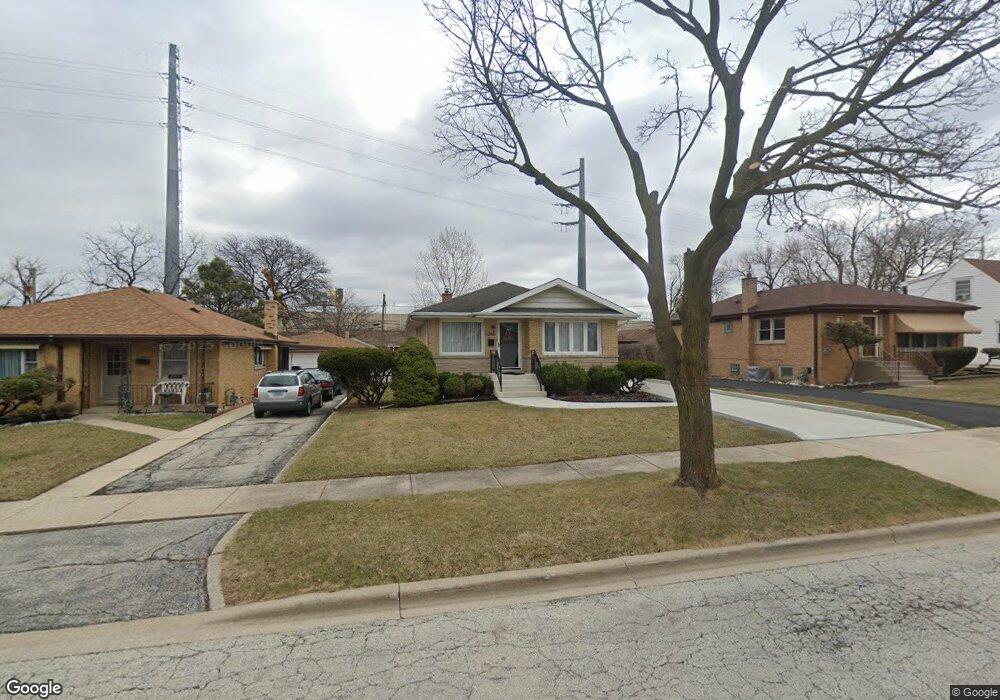
2045 High St Berkeley, IL 60163
Estimated Value: $280,000 - $300,000
3
Beds
1
Bath
1,016
Sq Ft
$288/Sq Ft
Est. Value
About This Home
This home is located at 2045 High St, Berkeley, IL 60163 and is currently estimated at $292,781, approximately $288 per square foot. 2045 High St is a home located in Cook County with nearby schools including Hillside Elementary School, Proviso West High School, and Visitation School.
Ownership History
Date
Name
Owned For
Owner Type
Purchase Details
Closed on
Oct 22, 1998
Sold by
Johnson Diane and Hilson Derrick
Bought by
Hilson Derrick A
Current Estimated Value
Home Financials for this Owner
Home Financials are based on the most recent Mortgage that was taken out on this home.
Original Mortgage
$123,927
Outstanding Balance
$24,877
Interest Rate
6.78%
Mortgage Type
FHA
Estimated Equity
$267,904
Purchase Details
Closed on
May 28, 1996
Sold by
Americanmidwest Bank & Trust
Bought by
Hilson Derrick A and Johnson Diane
Home Financials for this Owner
Home Financials are based on the most recent Mortgage that was taken out on this home.
Original Mortgage
$126,278
Interest Rate
7.97%
Mortgage Type
FHA
Create a Home Valuation Report for This Property
The Home Valuation Report is an in-depth analysis detailing your home's value as well as a comparison with similar homes in the area
Home Values in the Area
Average Home Value in this Area
Purchase History
| Date | Buyer | Sale Price | Title Company |
|---|---|---|---|
| Hilson Derrick A | -- | -- | |
| Hilson Derrick A | $195,000 | 1St American Title |
Source: Public Records
Mortgage History
| Date | Status | Borrower | Loan Amount |
|---|---|---|---|
| Open | Hilson Derrick A | $123,927 | |
| Closed | Hilson Derrick A | $126,278 |
Source: Public Records
Tax History
| Year | Tax Paid | Tax Assessment Tax Assessment Total Assessment is a certain percentage of the fair market value that is determined by local assessors to be the total taxable value of land and additions on the property. | Land | Improvement |
|---|---|---|---|---|
| 2025 | $3,756 | $21,000 | $3,850 | $17,150 |
| 2024 | $3,756 | $21,000 | $3,850 | $17,150 |
| 2023 | $5,449 | $21,000 | $3,850 | $17,150 |
| 2022 | $5,449 | $18,204 | $2,625 | $15,579 |
| 2021 | $5,315 | $18,203 | $2,625 | $15,578 |
| 2020 | $5,151 | $18,203 | $2,625 | $15,578 |
| 2019 | $3,550 | $13,016 | $2,450 | $10,566 |
| 2018 | $3,407 | $13,016 | $2,450 | $10,566 |
| 2017 | $3,954 | $15,015 | $2,450 | $12,565 |
| 2016 | $2,710 | $10,220 | $2,275 | $7,945 |
| 2015 | $3,458 | $12,600 | $2,275 | $10,325 |
| 2014 | $3,385 | $12,600 | $2,275 | $10,325 |
| 2013 | $3,808 | $14,823 | $2,275 | $12,548 |
Source: Public Records
Map
Nearby Homes
- 522 E Park Manor Ct
- 2050 Atwood Ave
- 956 S Cadwell Ave
- 928 S Hillcrest Ave
- 5949 School St
- 593 S Edgewood Ave
- 426 E Harrison St
- 250 N Irving Ave
- 504 N Irving Ave
- 277 E Oneida Ave
- 927 S Chatham Ave
- 15W320 Concord St
- 226 N Lind Ave
- 274 E Crescent Ave
- 515 S Parkview Ave
- 788 S Cambridge Ave
- 346 E South St
- 837 S Kearsage Ave
- 918 S Cambridge Ave
- 875 S York St
Your Personal Tour Guide
Ask me questions while you tour the home.