
Seller's Agent in 2025
Julie Wills
Howard Hanna Real Estate Svcs
(614) 855-8700
1 in this area
254 Total Sales
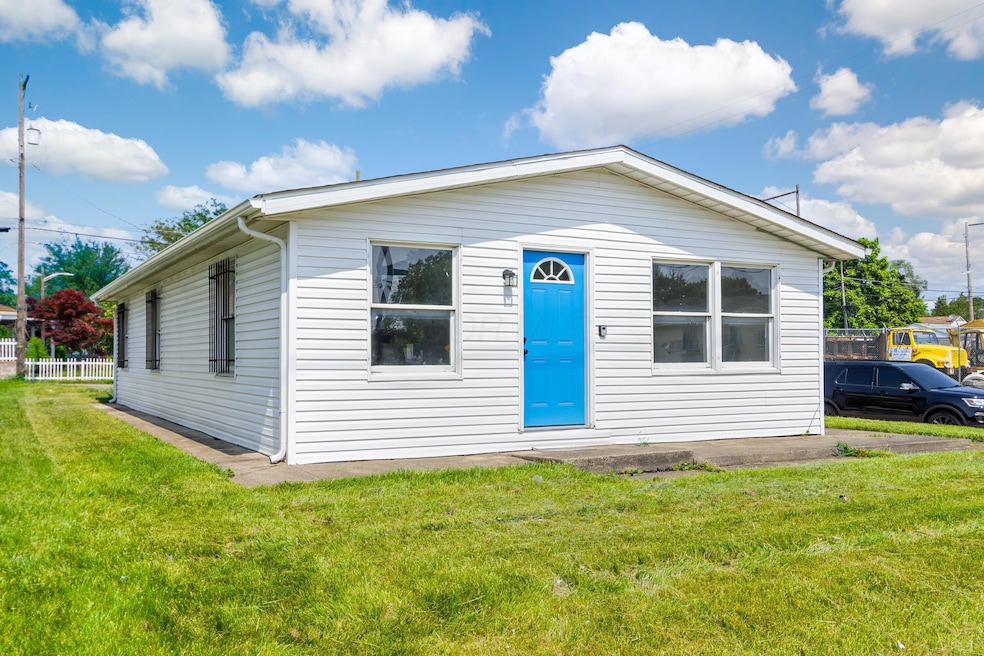
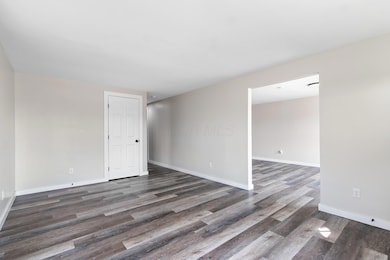
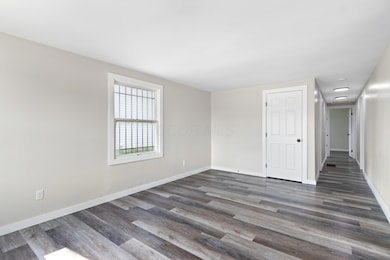

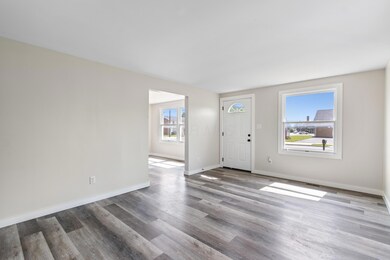
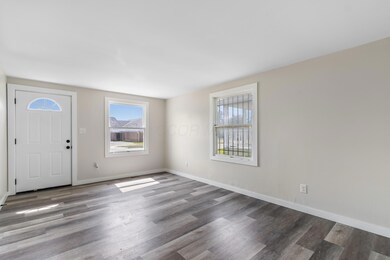
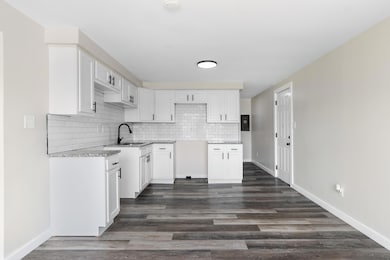
Step Into This Beautifully Renovated 3-Bedroom Home Where Comfort Meets Convenience. The Open, Functional Layout Is Enhanced By Abundant Natural Light, Creating A Warm And Inviting Atmosphere Throughout. Durable, Low-Maintenance Luxury Vinyl Plank Flooring Flows Seamlessly Across The Home, Complemented By Stylishly Updated Bathrooms. Perfectly Positioned In A Central Location, This Home Offers Easy Access For Your Daily Commute Or Makes An Excellent Addition To Any Investment Portfolio. Don't Miss Out—Schedule Your Private Showing Today!
Last Agent to Sell the Property
Howard Hanna Real Estate Svcs License #2009002401 Listed on: 08/19/2025
| Date | Type | Sale Price | Title Company |
|---|---|---|---|
| Warranty Deed | $149,000 | Win Title | |
| Quit Claim Deed | -- | Win Title | |
| Warranty Deed | -- | Bricker & Eckler Llp | |
| Warranty Deed | $49,000 | Pm Title Llc | |
| Warranty Deed | $49,000 | Pm Title | |
| Quit Claim Deed | $32,700 | None Available | |
| Warranty Deed | -- | None Available | |
| Warranty Deed | -- | -- |
| Date | Status | Loan Amount | Loan Type |
|---|---|---|---|
| Open | $146,301 | FHA | |
| Previous Owner | $76,000 | Credit Line Revolving |
| Date | Event | Price | List to Sale | Price per Sq Ft |
|---|---|---|---|---|
| 10/15/2025 10/15/25 | Sold | $149,000 | 0.0% | $141 / Sq Ft |
| 09/10/2025 09/10/25 | Price Changed | $149,000 | -6.3% | $141 / Sq Ft |
| 08/12/2025 08/12/25 | For Sale | $159,000 | +6.7% | $151 / Sq Ft |
| 06/28/2025 06/28/25 | Off Market | $149,000 | -- | -- |
| 06/13/2025 06/13/25 | For Sale | $159,000 | -- | $151 / Sq Ft |
| Year | Tax Paid | Tax Assessment Tax Assessment Total Assessment is a certain percentage of the fair market value that is determined by local assessors to be the total taxable value of land and additions on the property. | Land | Improvement |
|---|---|---|---|---|
| 2024 | $1,990 | $25,760 | $2,730 | $23,030 |
| 2023 | $1,347 | $25,760 | $2,730 | $23,030 |
| 2022 | $791 | $13,830 | $1,820 | $12,010 |
| 2021 | $886 | $13,830 | $1,820 | $12,010 |
| 2020 | $969 | $13,830 | $1,820 | $12,010 |
| 2019 | $897 | $11,450 | $1,540 | $9,910 |
| 2018 | $768 | $11,450 | $1,540 | $9,910 |
| 2017 | $762 | $11,450 | $1,540 | $9,910 |
| 2016 | $780 | $11,480 | $1,400 | $10,080 |
| 2015 | $826 | $12,110 | $2,030 | $10,080 |
| 2014 | $751 | $12,110 | $2,030 | $10,080 |
| 2013 | $430 | $13,440 | $2,240 | $11,200 |
Seller's Agent in 2025
Julie Wills
Howard Hanna Real Estate Svcs
(614) 855-8700
1 in this area
254 Total Sales
M
Seller Co-Listing Agent in 2025
Mathias Wells
Howard Hanna Real Estate Svcs
(304) 694-0446
1 in this area
9 Total Sales
Buyer's Agent in 2025
Thomas Few
E-Merge
(614) 940-6138
1 in this area
41 Total Sales
Source: Columbus and Central Ohio Regional MLS
MLS Number: 225021471
APN: 010-099055
Disclaimer: Certain information contained herein is derived from information provided by parties other than Homes.com. All information provided is deemed reliable, but is not guaranteed to be accurate and should be independently verified.
![]() IDX information is provided exclusively for personal, non-commercial use, and may not be used for any purpose other than to identify prospective properties consumers may be interested in purchasing.
IDX information is provided exclusively for personal, non-commercial use, and may not be used for any purpose other than to identify prospective properties consumers may be interested in purchasing.
Information is deemed reliable but not guaranteed.