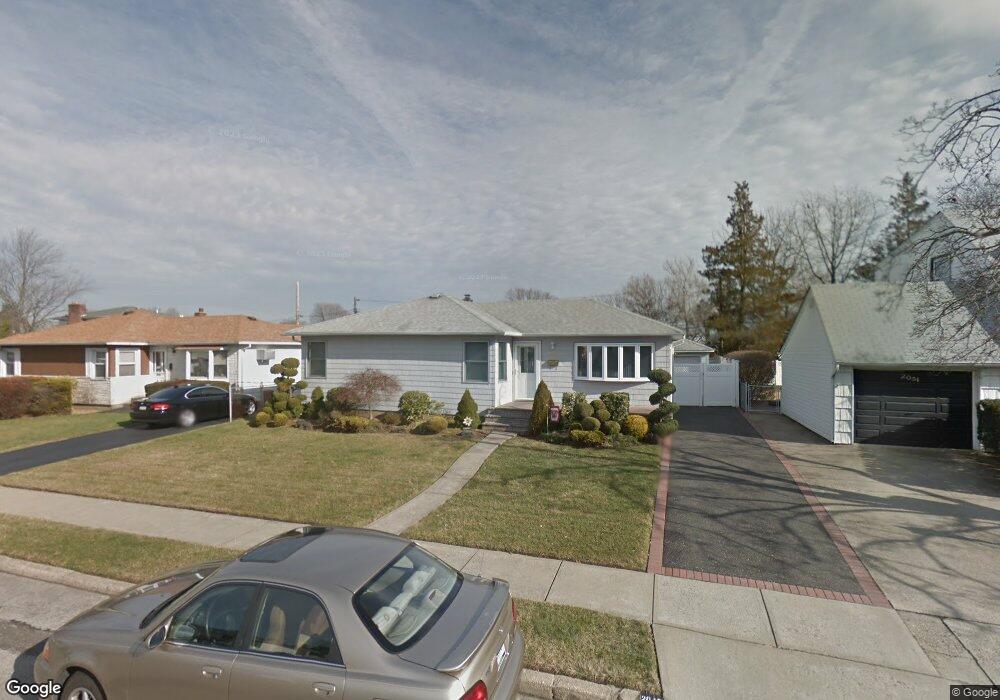
2045 Stirrup Path Seaford, NY 11783
Estimated Value: $662,000 - $703,045
--
Bed
1
Bath
1,036
Sq Ft
$659/Sq Ft
Est. Value
About This Home
This home is located at 2045 Stirrup Path, Seaford, NY 11783 and is currently estimated at $682,523, approximately $658 per square foot. 2045 Stirrup Path is a home located in Nassau County with nearby schools including Seaford Middle School, Seaford Senior High School, and St. William the Abbot School.
Ownership History
Date
Name
Owned For
Owner Type
Purchase Details
Closed on
Sep 22, 2023
Sold by
Bisignano Ralph and Bisignano Theresa
Bought by
Mckeveny Kayla
Current Estimated Value
Home Financials for this Owner
Home Financials are based on the most recent Mortgage that was taken out on this home.
Original Mortgage
$409,500
Outstanding Balance
$400,809
Interest Rate
7.19%
Mortgage Type
New Conventional
Estimated Equity
$281,714
Purchase Details
Closed on
Jun 11, 1996
Sold by
Piccolo Salvatore and Piccolo Marguerite
Bought by
Bisignano Ralph and Bisignano Theresa
Home Financials for this Owner
Home Financials are based on the most recent Mortgage that was taken out on this home.
Original Mortgage
$134,000
Interest Rate
8.21%
Mortgage Type
Purchase Money Mortgage
Create a Home Valuation Report for This Property
The Home Valuation Report is an in-depth analysis detailing your home's value as well as a comparison with similar homes in the area
Home Values in the Area
Average Home Value in this Area
Purchase History
| Date | Buyer | Sale Price | Title Company |
|---|---|---|---|
| Mckeveny Kayla | $630,000 | Chicago Title Insurance Co | |
| Mckeveny Kayla | $630,000 | Chicago Title Insurance Co | |
| Mckeveny Kayla | $630,000 | Chicago Title Insurance Co | |
| Mckeveny Kayla | $630,000 | Chicago Title Insurance Co | |
| Bisignano Ralph | $184,000 | -- | |
| Bisignano Ralph | $184,000 | -- |
Source: Public Records
Mortgage History
| Date | Status | Borrower | Loan Amount |
|---|---|---|---|
| Open | Mckeveny Kayla | $409,500 | |
| Closed | Mckeveny Kayla | $409,500 | |
| Previous Owner | Bisignano Ralph | $134,000 |
Source: Public Records
Tax History Compared to Growth
Tax History
| Year | Tax Paid | Tax Assessment Tax Assessment Total Assessment is a certain percentage of the fair market value that is determined by local assessors to be the total taxable value of land and additions on the property. | Land | Improvement |
|---|---|---|---|---|
| 2025 | $11,027 | $375 | $173 | $202 |
| 2024 | $2,960 | $400 | $185 | $215 |
| 2023 | $10,971 | $420 | $194 | $226 |
| 2022 | $10,971 | $424 | $196 | $228 |
| 2021 | $15,692 | $422 | $195 | $227 |
| 2020 | $12,128 | $768 | $657 | $111 |
| 2019 | $12,494 | $768 | $657 | $111 |
| 2018 | $11,746 | $768 | $0 | $0 |
| 2017 | $7,169 | $768 | $657 | $111 |
| 2016 | $10,522 | $768 | $657 | $111 |
| 2015 | $3,129 | $768 | $657 | $111 |
| 2014 | $3,129 | $768 | $657 | $111 |
| 2013 | $2,935 | $768 | $657 | $111 |
Source: Public Records
Map
Nearby Homes
- 3532 Waverly Ave
- 3541 Kenora Place
- 3731 Park Ave
- 3861 Wilburne Ave
- 2175 Spruce St
- 2104 Fir St
- 2067 Jackson Ave
- 1823 Lincoln Ave
- 2089 Beech St
- 3608 Tonopah St
- 3615 Franklin St
- 3945 Hickory St
- 2217 Fir St
- 1750 Yale Ct
- 3612 Ladonia St
- 2370 Narraganset Ave
- 3969 Marlow Ct
- 2327 Mattituck Ave
- 3268 Jackson Ave
- 2335 Maple St
- 2039 Stirrup Path
- 2051 Stirrup Path
- 2052 Guildford Park Dr
- 2046 Guildford Park Dr
- 2059 Stirrup Path
- 2027 Stirrup Path
- 2058 Guildford Park Dr
- 3636 Woodward Ave
- 2044 Stirrup Path
- 2038 Stirrup Path
- 2050 Stirrup Path
- 2067 Stirrup Path
- 2034 Guildford Park Dr
- 2026 Stirrup Path
- 2062 Guildford Park Dr
- 2054 Stirrup Path
- 2058 Stirrup Path
- 2073 Stirrup Path
- 3612 Woodward Ave
- 2047 Guildford Park Dr