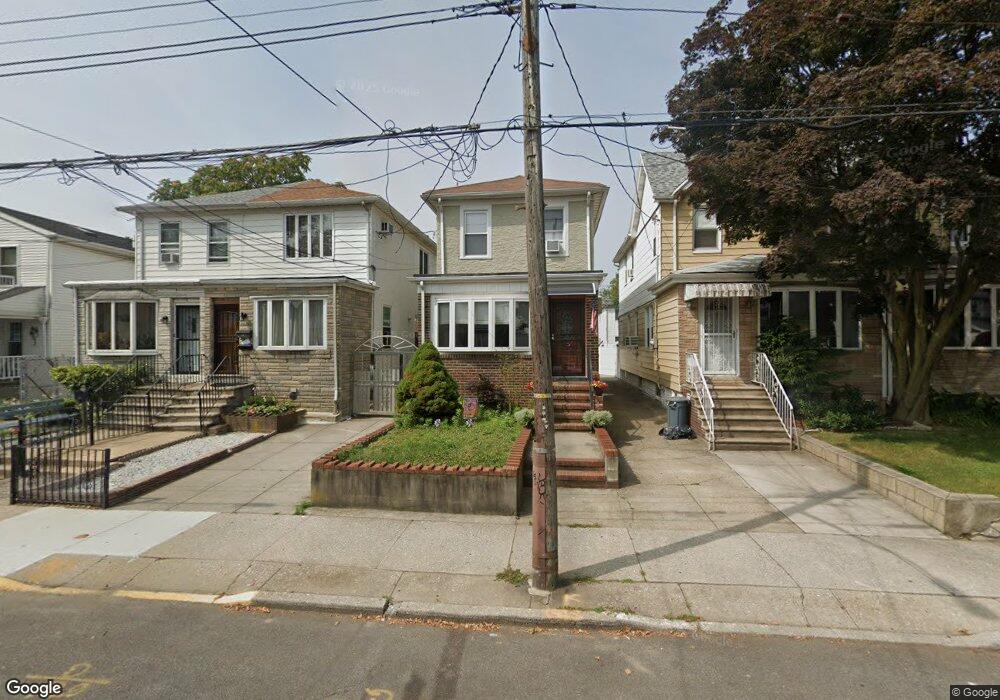
2046 Hendrickson St Unit HOUSE Brooklyn, NY 11234
Marine Park NeighborhoodEstimated Value: $744,000 - $949,000
4
Beds
3
Baths
1,074
Sq Ft
$786/Sq Ft
Est. Value
About This Home
This home is located at 2046 Hendrickson St Unit HOUSE, Brooklyn, NY 11234 and is currently estimated at $844,624, approximately $786 per square foot. 2046 Hendrickson St Unit HOUSE is a home located in Kings County with nearby schools including Ps 207 Elizabeth G Leary, J.H.S. 278 Marine Park, and James Madison High School.
Ownership History
Date
Name
Owned For
Owner Type
Purchase Details
Closed on
Aug 5, 2022
Sold by
Lee Nancy Yi and Mak Kwok Chu
Bought by
Armada Cirilina and Armada Kristine Joy
Current Estimated Value
Home Financials for this Owner
Home Financials are based on the most recent Mortgage that was taken out on this home.
Original Mortgage
$651,200
Outstanding Balance
$622,580
Interest Rate
5.51%
Mortgage Type
Purchase Money Mortgage
Estimated Equity
$222,044
Purchase Details
Closed on
Jun 6, 2018
Sold by
Albert Demutiis As Trustee
Bought by
Lee Nancy Yi and Mak Kwok Chu
Home Financials for this Owner
Home Financials are based on the most recent Mortgage that was taken out on this home.
Original Mortgage
$364,000
Interest Rate
4.5%
Mortgage Type
Purchase Money Mortgage
Create a Home Valuation Report for This Property
The Home Valuation Report is an in-depth analysis detailing your home's value as well as a comparison with similar homes in the area
Home Values in the Area
Average Home Value in this Area
Purchase History
| Date | Buyer | Sale Price | Title Company |
|---|---|---|---|
| Armada Cirilina | $880,000 | -- | |
| Lee Nancy Yi | $560,000 | -- |
Source: Public Records
Mortgage History
| Date | Status | Borrower | Loan Amount |
|---|---|---|---|
| Open | Armada Cirilina | $651,200 | |
| Previous Owner | Lee Nancy Yi | $364,000 |
Source: Public Records
Tax History Compared to Growth
Tax History
| Year | Tax Paid | Tax Assessment Tax Assessment Total Assessment is a certain percentage of the fair market value that is determined by local assessors to be the total taxable value of land and additions on the property. | Land | Improvement |
|---|---|---|---|---|
| 2025 | $6,074 | $41,280 | $9,360 | $31,920 |
| 2024 | $6,074 | $42,060 | $9,360 | $32,700 |
| 2023 | $6,095 | $44,400 | $9,360 | $35,040 |
| 2022 | $5,652 | $39,780 | $9,360 | $30,420 |
| 2021 | $5,622 | $39,480 | $9,360 | $30,120 |
| 2020 | $4,216 | $42,180 | $9,360 | $32,820 |
| 2019 | $5,272 | $41,640 | $9,360 | $32,280 |
| 2018 | $1,401 | $25,010 | $7,320 | $17,690 |
| 2017 | $1,508 | $23,595 | $6,357 | $17,238 |
| 2016 | $1,368 | $22,260 | $7,341 | $14,919 |
| 2015 | $476 | $21,000 | $10,380 | $10,620 |
| 2014 | $476 | $21,000 | $10,380 | $10,620 |
Source: Public Records
Map
Nearby Homes
- 2068 Hendrickson St
- 2055 Coleman St
- 2077 Hendrickson St
- 2061 Coleman St
- 4104 Avenue S
- 1920 E 52nd St
- 2064 Coleman St
- 4209 Avenue S
- 1906 E 52nd St
- 4016 Avenue S
- 4106 Avenue T
- 1931 E 52nd St
- 2077 Kimball St
- 1900 E 51st St
- 2121 Kimball St
- 2057 Ryder St
- 2125 Ryder St
- 3821 Avenue S
- 1936 Kimball St
- 2333 Utica Ave
- 2046 Hendrickson St
- 2048 Hendrickson St
- 2040 Hendrickson St
- 2050 Hendrickson St
- 2038 Hendrickson St
- 2036 Hendrickson St
- 2052 Hendrickson St
- 2032 Hendrickson St
- 2043 Coleman St
- 2039 Coleman St
- 2045 Coleman St
- 2056 Hendrickson St
- 2037 Coleman St
- 2028 Hendrickson St
- 2049 Coleman St
- 2033 Coleman St Unit 2035
- 2033-2035 Coleman St
- 2051 Coleman St
- 2026 Hendrickson St
- 2031 Coleman St Unit 2033