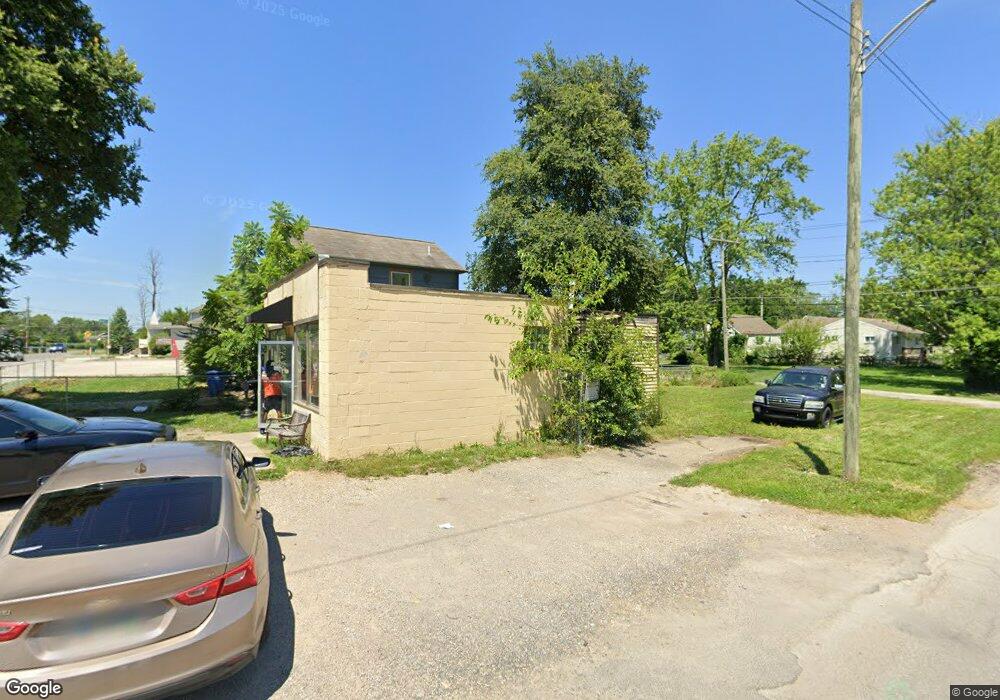
2046 Mock Rd Columbus, OH 43219
Argyle Park NeighborhoodEstimated Value: $111,644
--
Bed
--
Bath
712
Sq Ft
$157/Sq Ft
Est. Value
About This Home
This home is located at 2046 Mock Rd, Columbus, OH 43219 and is currently estimated at $111,644, approximately $156 per square foot. 2046 Mock Rd is a home located in Franklin County with nearby schools including South Mifflin Stem Academy (K-6), Linden-Mckinley Stem School On Arcadia, and Cesar Chavez College Preparatory School.
Ownership History
Date
Name
Owned For
Owner Type
Purchase Details
Closed on
Aug 7, 2006
Sold by
Lewis Capital Estates Llc
Bought by
Edna Mae Bush Llc
Current Estimated Value
Home Financials for this Owner
Home Financials are based on the most recent Mortgage that was taken out on this home.
Original Mortgage
$50,000
Interest Rate
6.68%
Mortgage Type
Seller Take Back
Purchase Details
Closed on
Jun 14, 2006
Sold by
Edna Mae Bush Llc
Bought by
Lewis Capital Estates Llc
Home Financials for this Owner
Home Financials are based on the most recent Mortgage that was taken out on this home.
Original Mortgage
$50,000
Interest Rate
6.68%
Mortgage Type
Seller Take Back
Purchase Details
Closed on
May 14, 2001
Sold by
Prater Cassandra C
Bought by
Edna Mae Bush Llc
Purchase Details
Closed on
Aug 30, 1999
Sold by
Bush Anthony D
Bought by
Prater John C
Purchase Details
Closed on
Apr 30, 1993
Bought by
Bush Anthony D
Purchase Details
Closed on
Jun 17, 1991
Create a Home Valuation Report for This Property
The Home Valuation Report is an in-depth analysis detailing your home's value as well as a comparison with similar homes in the area
Home Values in the Area
Average Home Value in this Area
Purchase History
| Date | Buyer | Sale Price | Title Company |
|---|---|---|---|
| Edna Mae Bush Llc | $50,000 | Land & Mo | |
| Lewis Capital Estates Llc | $50,000 | Land & Mo | |
| Edna Mae Bush Llc | -- | -- | |
| Prater Cassandra C | -- | -- | |
| Prater John C | $7,900 | -- | |
| Bush Anthony D | $5,000 | -- | |
| -- | $5,400 | -- |
Source: Public Records
Mortgage History
| Date | Status | Borrower | Loan Amount |
|---|---|---|---|
| Previous Owner | Lewis Capital Estates Llc | $50,000 |
Source: Public Records
Tax History Compared to Growth
Tax History
| Year | Tax Paid | Tax Assessment Tax Assessment Total Assessment is a certain percentage of the fair market value that is determined by local assessors to be the total taxable value of land and additions on the property. | Land | Improvement |
|---|---|---|---|---|
| 2024 | $1,031 | $11,870 | $8,820 | $3,050 |
| 2023 | $867 | $11,870 | $8,820 | $3,050 |
| 2022 | $1,559 | $6,160 | $2,240 | $3,920 |
| 2021 | $518 | $6,160 | $2,240 | $3,920 |
| 2020 | $461 | $6,160 | $2,240 | $3,920 |
| 2019 | $505 | $5,600 | $2,030 | $3,570 |
| 2018 | $442 | $5,600 | $2,030 | $3,570 |
| 2017 | $461 | $5,600 | $2,030 | $3,570 |
| 2016 | $457 | $5,250 | $2,030 | $3,220 |
| 2015 | $424 | $5,250 | $2,030 | $3,220 |
| 2014 | $424 | $5,250 | $2,030 | $3,220 |
| 2013 | $210 | $5,250 | $2,030 | $3,220 |
Source: Public Records
Map
Nearby Homes
- 0 Rankin Ave Unit (Rear)
- 1975 Mock Rd
- 0 Parkwood Ave
- 2040 Loretta Ave
- 2054 Jermain Dr
- 1991 Woodland Ave
- 0 Danby Dr
- 1864 E Hudson St
- 2055 Earl Ave
- 1938 Myrtle Ave
- 0 Mock Rd
- 1799 Harold Place
- 2480 Parkwood Ave
- 2336 Edenburgh Dr S
- 1882 Dunning Rd
- 1810 E 26th Ave
- 1995 Minnesota Ave
- 1789 Marston Rd
- 2471 Mock Rd
- 1790 Marston Rd