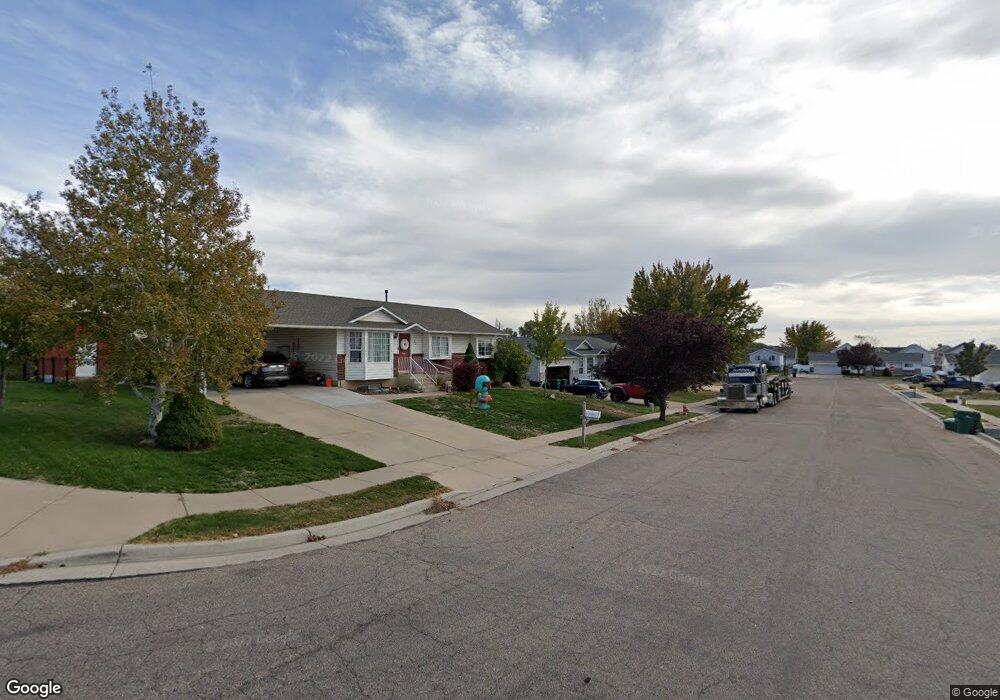
2046 N 300 W Clearfield, UT 84015
Estimated Value: $385,344 - $423,000
4
Beds
2
Baths
1,296
Sq Ft
$311/Sq Ft
Est. Value
About This Home
This home is located at 2046 N 300 W, Clearfield, UT 84015 and is currently estimated at $403,086, approximately $311 per square foot. 2046 N 300 W is a home located in Davis County with nearby schools including Sunset School, Sunset Junior High School, and Northridge High School.
Ownership History
Date
Name
Owned For
Owner Type
Purchase Details
Closed on
Oct 17, 2019
Sold by
Bitton Val C and Bitton Marilyn
Bought by
Bitton Kelly D
Current Estimated Value
Home Financials for this Owner
Home Financials are based on the most recent Mortgage that was taken out on this home.
Original Mortgage
$160,000
Interest Rate
3.5%
Mortgage Type
New Conventional
Purchase Details
Closed on
Jun 14, 2010
Sold by
Bitton Val C and Bitton Marilyn
Bought by
Bitton Val C and Bitton Marilyn
Purchase Details
Closed on
Oct 28, 2009
Sold by
Bitton Val C and Bitton Marilyn
Bought by
Bitton Val C and Bitton Marilyn
Home Financials for this Owner
Home Financials are based on the most recent Mortgage that was taken out on this home.
Original Mortgage
$124,000
Interest Rate
5%
Mortgage Type
New Conventional
Create a Home Valuation Report for This Property
The Home Valuation Report is an in-depth analysis detailing your home's value as well as a comparison with similar homes in the area
Home Values in the Area
Average Home Value in this Area
Purchase History
| Date | Buyer | Sale Price | Title Company |
|---|---|---|---|
| Bitton Kelly D | -- | Stewart Title Ins Agency | |
| Bitton Val C | -- | None Available | |
| Bitton Val C | -- | Eagle Pointe Title Ins | |
| Bitton Val C | -- | Eagle Pointe Title Ins Agenc |
Source: Public Records
Mortgage History
| Date | Status | Borrower | Loan Amount |
|---|---|---|---|
| Closed | Bitton Kelly D | $160,000 | |
| Closed | Bitton Val C | $124,000 |
Source: Public Records
Tax History Compared to Growth
Tax History
| Year | Tax Paid | Tax Assessment Tax Assessment Total Assessment is a certain percentage of the fair market value that is determined by local assessors to be the total taxable value of land and additions on the property. | Land | Improvement |
|---|---|---|---|---|
| 2025 | $2,472 | $225,500 | $77,246 | $148,254 |
| 2024 | $2,237 | $204,050 | $73,813 | $130,237 |
| 2023 | $2,092 | $348,000 | $117,617 | $230,383 |
| 2022 | $2,254 | $202,950 | $66,980 | $135,970 |
| 2021 | $1,929 | $273,000 | $73,675 | $199,325 |
| 2020 | $1,696 | $236,000 | $62,447 | $173,553 |
| 2019 | $1,598 | $228,000 | $76,844 | $151,156 |
| 2018 | $1,424 | $199,000 | $61,410 | $137,590 |
| 2016 | $1,206 | $86,570 | $29,048 | $57,522 |
| 2015 | $1,172 | $79,695 | $28,905 | $50,790 |
| 2014 | $1,040 | $72,319 | $28,905 | $43,414 |
| 2013 | -- | $65,670 | $23,265 | $42,405 |
Source: Public Records
Map
Nearby Homes
- 1874 N 200 W
- 1974 N 75 W
- 2085 N Main St Unit 409
- 2085 N Main St Unit 108
- 2085 N Main St Unit 401
- 2085 N Main St Unit 308
- 2085 N Main St Unit 116
- 2085 N Main St Unit 201
- 2085 N Main St Unit 402
- 2085 N Main St Unit 202
- 2085 N Main St Unit 301
- 2085 N Main St Unit 302
- 2085 N Main St Unit 115
- 52 W 2000 N
- 2177 N 450 W
- 2101 N Main St Unit 205
- 2101 N Main St Unit 409
- 1746 N 475 W
- 1721 N 400 W
- 1696 N 475 W