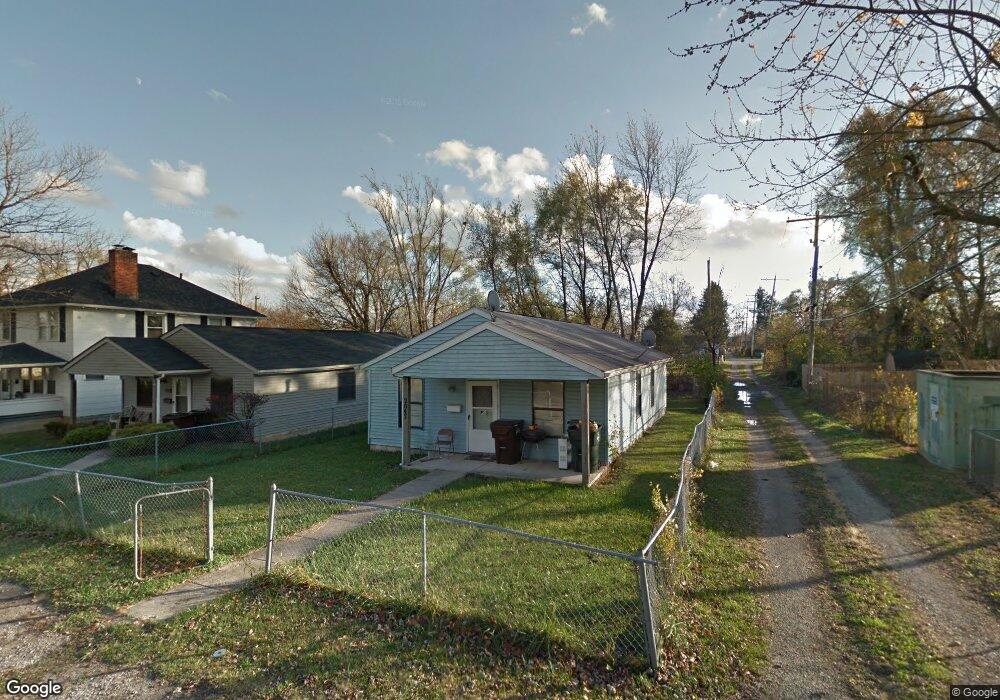
2047 Myrtle Ave Columbus, OH 43211
Arlington Park NeighborhoodEstimated Value: $119,000 - $203,000
3
Beds
1
Bath
1,056
Sq Ft
$146/Sq Ft
Est. Value
About This Home
This home is located at 2047 Myrtle Ave, Columbus, OH 43211 and is currently estimated at $154,442, approximately $146 per square foot. 2047 Myrtle Ave is a home located in Franklin County with nearby schools including East Linden Elementary School, Mifflin Middle School, and Mifflin High School.
Ownership History
Date
Name
Owned For
Owner Type
Purchase Details
Closed on
Nov 10, 2011
Sold by
Green Vanessa M
Bought by
Martin Nicole M
Current Estimated Value
Purchase Details
Closed on
May 5, 1997
Sold by
Greater Columbus Habitat For Humanity
Bought by
Green Vanessa M
Home Financials for this Owner
Home Financials are based on the most recent Mortgage that was taken out on this home.
Original Mortgage
$37,499
Interest Rate
8.05%
Mortgage Type
Seller Take Back
Purchase Details
Closed on
Mar 18, 1997
Sold by
Martin Nicole M
Bought by
Greater Columbus Habitat For Humanity
Home Financials for this Owner
Home Financials are based on the most recent Mortgage that was taken out on this home.
Original Mortgage
$37,499
Interest Rate
8.05%
Mortgage Type
Seller Take Back
Create a Home Valuation Report for This Property
The Home Valuation Report is an in-depth analysis detailing your home's value as well as a comparison with similar homes in the area
Home Values in the Area
Average Home Value in this Area
Purchase History
| Date | Buyer | Sale Price | Title Company |
|---|---|---|---|
| Martin Nicole M | -- | None Available | |
| Green Vanessa M | $43,000 | Hummel Title Agency Inc | |
| Greater Columbus Habitat For Humanity | $43,000 | -- |
Source: Public Records
Mortgage History
| Date | Status | Borrower | Loan Amount |
|---|---|---|---|
| Previous Owner | Green Vanessa M | $37,499 | |
| Previous Owner | Greater Columbus Habitat For Humanity | $37,499 | |
| Closed | Green Vanessa M | $6,000 |
Source: Public Records
Tax History
| Year | Tax Paid | Tax Assessment Tax Assessment Total Assessment is a certain percentage of the fair market value that is determined by local assessors to be the total taxable value of land and additions on the property. | Land | Improvement |
|---|---|---|---|---|
| 2025 | $14,347 | $38,160 | $6,270 | $31,890 |
| 2024 | $14,347 | $38,160 | $6,270 | $31,890 |
| 2023 | $3,776 | $38,150 | $6,265 | $31,885 |
| 2022 | $14,502 | $12,990 | $1,650 | $11,340 |
| 2021 | $2,584 | $12,990 | $1,650 | $11,340 |
| 2020 | $2,511 | $12,990 | $1,650 | $11,340 |
| 2019 | $4,303 | $10,960 | $1,440 | $9,520 |
| 2018 | $1,186 | $10,960 | $1,440 | $9,520 |
| 2017 | $1,547 | $10,960 | $1,440 | $9,520 |
| 2016 | $1,511 | $14,530 | $1,540 | $12,990 |
| 2015 | $1,289 | $14,530 | $1,540 | $12,990 |
| 2014 | $1,291 | $14,530 | $1,540 | $12,990 |
| 2013 | $1,166 | $17,115 | $1,820 | $15,295 |
Source: Public Records
Map
Nearby Homes
- 1938 Myrtle Ave
- 2475 Parkwood Ave
- 0 Parkwood Ave
- 2192 Genessee Ave
- 2422 Joyce Ave
- 1864 E Hudson St
- 1971 Aberdeen Ave
- 2451 Joyce Ave
- 1799 Harold Place
- 2080 Parkwood Ave Unit 2090
- 1888 Aberdeen Ave
- 0 Danby Dr
- 2310 Brentnell Ave
- 1326 Minnesota Ave
- 2054 Jermain Dr
- 2271 Century Dr
- 2345 Century Dr
- 1991 Woodland Ave
- 2282 Dawnlight Ave
- 2735 Berrell Ave
- 2051 Myrtle Ave
- 2368 Parkwood Ave
- 2057 Myrtle Ave
- 2362 Parkwood Ave
- 2360 Parkwood Ave
- 2360 Parkwood Ave Unit OH
- 0 Myrtle Ave
- 2352 Parkwood Ave
- 2042 Briarwood Ave
- 2048 Briarwood Ave
- 2063 Myrtle Ave
- 2348 Parkwood Ave
- 2048 Myrtle Ave
- 0 Myrtle Ave
- 0 Myrtle Ave
- 2342 Parkwood Ave
- 2058 Briarwood Ave
- 2060 Myrtle Ave
- 2079 Myrtle Ave
- 2062 Briarwood Ave
Your Personal Tour Guide
Ask me questions while you tour the home.