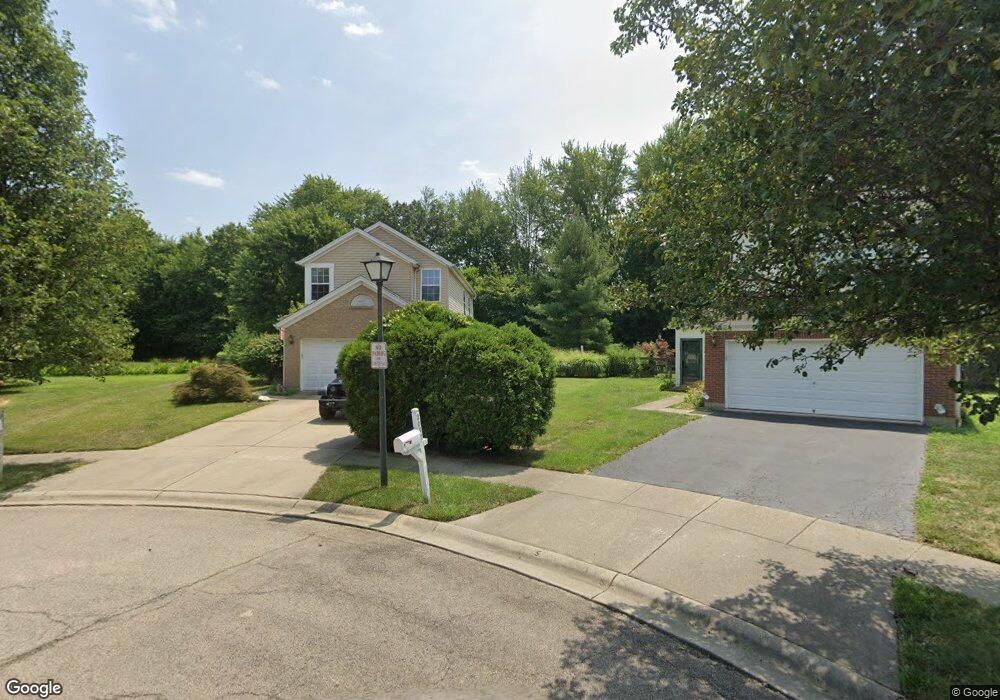
2047 Sheriton Ct Loveland, OH 45140
Estimated Value: $227,000 - $273,691
3
Beds
3
Baths
1,514
Sq Ft
$169/Sq Ft
Est. Value
About This Home
This home is located at 2047 Sheriton Ct, Loveland, OH 45140 and is currently estimated at $256,423, approximately $169 per square foot. 2047 Sheriton Ct is a home located in Clermont County with nearby schools including Marr/Cook Elementary School, Spaulding Elementary School, and Goshen Middle School.
Ownership History
Date
Name
Owned For
Owner Type
Purchase Details
Closed on
Jun 18, 2025
Sold by
Egan Samual D
Bought by
Sfr Owner I Llc
Current Estimated Value
Purchase Details
Closed on
Nov 30, 2011
Sold by
Beneficial Financial I Inc
Bought by
Egan Samual D
Home Financials for this Owner
Home Financials are based on the most recent Mortgage that was taken out on this home.
Original Mortgage
$97,465
Interest Rate
3.75%
Mortgage Type
FHA
Purchase Details
Closed on
Aug 22, 2011
Sold by
Fordyce Holly and Fordyce Lester
Bought by
Beneficial Ohio Inc
Purchase Details
Closed on
Dec 6, 2000
Sold by
M I Schottenstein Homes
Bought by
Grove Michelle C
Home Financials for this Owner
Home Financials are based on the most recent Mortgage that was taken out on this home.
Original Mortgage
$133,582
Interest Rate
7.7%
Mortgage Type
FHA
Create a Home Valuation Report for This Property
The Home Valuation Report is an in-depth analysis detailing your home's value as well as a comparison with similar homes in the area
Home Values in the Area
Average Home Value in this Area
Purchase History
| Date | Buyer | Sale Price | Title Company |
|---|---|---|---|
| Sfr Owner I Llc | $225,000 | None Listed On Document | |
| Egan Samual D | $100,000 | Omega Title Agency Llc | |
| Beneficial Ohio Inc | $80,000 | None Available | |
| Grove Michelle C | $134,307 | -- |
Source: Public Records
Mortgage History
| Date | Status | Borrower | Loan Amount |
|---|---|---|---|
| Previous Owner | Egan Samual D | $97,465 | |
| Previous Owner | Mcnamee Stephen J | $133,582 |
Source: Public Records
Tax History Compared to Growth
Tax History
| Year | Tax Paid | Tax Assessment Tax Assessment Total Assessment is a certain percentage of the fair market value that is determined by local assessors to be the total taxable value of land and additions on the property. | Land | Improvement |
|---|---|---|---|---|
| 2024 | $3,432 | $75,960 | $13,200 | $62,760 |
| 2023 | $3,320 | $75,960 | $13,200 | $62,760 |
| 2022 | $2,607 | $52,330 | $9,100 | $43,230 |
| 2021 | $2,622 | $52,330 | $9,100 | $43,230 |
| 2020 | $2,452 | $52,330 | $9,100 | $43,230 |
| 2019 | $2,206 | $45,090 | $8,790 | $36,300 |
| 2018 | $2,215 | $45,090 | $8,790 | $36,300 |
| 2017 | $2,039 | $45,090 | $8,790 | $36,300 |
| 2016 | $2,076 | $39,550 | $7,700 | $31,850 |
| 2015 | $1,840 | $39,550 | $7,700 | $31,850 |
| 2014 | $1,840 | $39,550 | $7,700 | $31,850 |
| 2013 | $1,778 | $39,900 | $8,750 | $31,150 |
Source: Public Records
Map
Nearby Homes
- 2066 Cameron Crossing
- 1019 Canterbury Ln
- 6442 Charles Snider Rd
- 3009 Abby Way
- 411 Catrina Ct
- 5934 Marsh Cir
- 374a Redbird Dr
- 1786 Broadstone Cir
- Birch with Full Basement Plan at Barclay Woods
- Elder with Full Basement Plan at Barclay Woods
- Cedar with Full Basement Plan at Barclay Woods
- Tupelo with Full Basement Plan at Barclay Woods
- Aspen with Full Basement Plan at Barclay Woods
- 5997 Marsh Cir
- 5718 Clemens Dr
- 6540 Glen Eagle Way
- 6554 Glen Eagle Way
- 6535 Glen Eagle Way
- 1788 Heritage Woods Dr
- 1811 Louis Ln
- 2045 Sheriton Ct
- 2082 Sheriton Ct
- 2043 Sheriton Ct
- 2043 Sheriton Ct Unit 23
- 2020 Collingwood Ct
- 2080 Sheriton Ct
- 2041 Sheriton Ct
- 2016 Collingwood Ct
- 2076 Sheriton Ct
- 2076 Sheriton Ct
- 2076 Sheriton Ct Unit 28
- 2017 Collingwood Ct
- 2074 Sheriton Ct
- 2014 Collingwood Ct
- 2070 Sheriton Ct
- 2102 Wood Brook Ct
- 2010 Collingwood Ct
- 2104 Wood Brook Ct
- 2015 Collingwood Ct
- 2068 Sheriton Ct