Estimated Value: $720,000 - $837,000
6
Beds
3
Baths
3,150
Sq Ft
$245/Sq Ft
Est. Value
About This Home
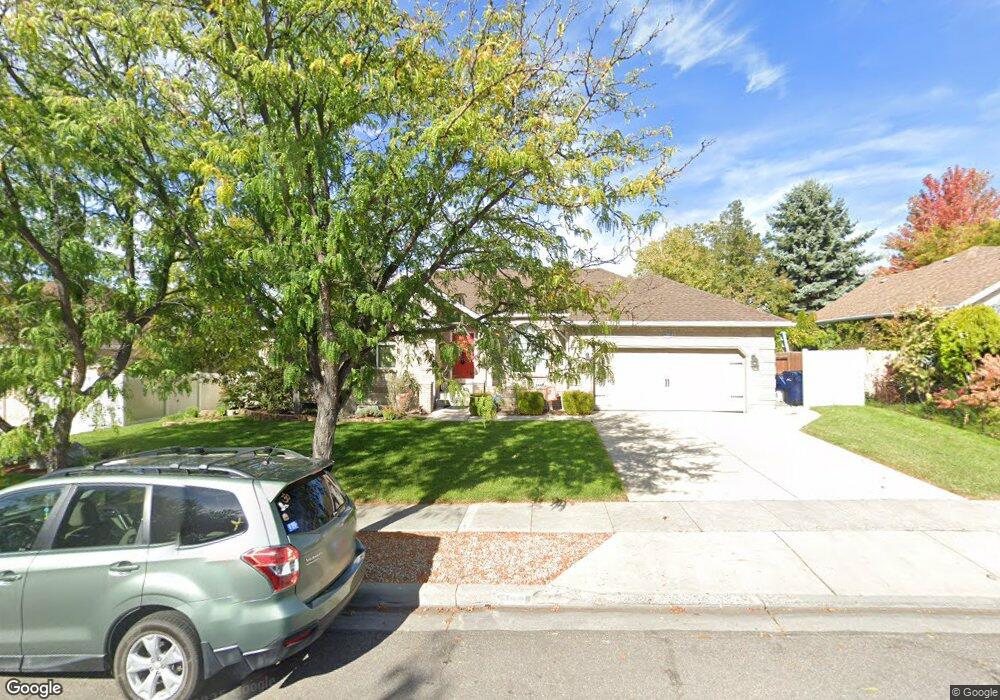
This home is located at 2047 Village Point Way, Sandy, UT 84093 and is currently estimated at $771,608, approximately $244 per square foot. 2047 Village Point Way is a home located in Salt Lake County with nearby schools including Quail Hollow Elementary School, Albion Middle School, and Brighton High School.
Ownership History
Date
Name
Owned For
Owner Type
Purchase Details
Closed on
Dec 14, 2006
Sold by
Gabriele Don E and Morgan Cherie A
Bought by
Roper Lynette
Current Estimated Value
Home Financials for this Owner
Home Financials are based on the most recent Mortgage that was taken out on this home.
Original Mortgage
$257,000
Outstanding Balance
$153,740
Interest Rate
6.32%
Mortgage Type
Unknown
Estimated Equity
$617,868
Purchase Details
Closed on
Feb 5, 2002
Sold by
Brightwell Cathy L
Bought by
Gabriele Don E and Morgan Cherie A
Home Financials for this Owner
Home Financials are based on the most recent Mortgage that was taken out on this home.
Original Mortgage
$214,605
Interest Rate
6.8%
Purchase Details
Closed on
May 8, 2000
Sold by
Bond Dale R and Bond Julie N
Bought by
Brightwell Cathy L
Home Financials for this Owner
Home Financials are based on the most recent Mortgage that was taken out on this home.
Original Mortgage
$178,900
Interest Rate
8.25%
Create a Home Valuation Report for This Property
The Home Valuation Report is an in-depth analysis detailing your home's value as well as a comparison with similar homes in the area
Home Values in the Area
Average Home Value in this Area
Purchase History
| Date | Buyer | Sale Price | Title Company |
|---|---|---|---|
| Roper Lynette | -- | Backman Title Services | |
| Gabriele Don E | -- | First American Title | |
| Brightwell Cathy L | -- | Founders Title |
Source: Public Records
Mortgage History
| Date | Status | Borrower | Loan Amount |
|---|---|---|---|
| Open | Roper Lynette | $257,000 | |
| Previous Owner | Gabriele Don E | $214,605 | |
| Previous Owner | Brightwell Cathy L | $178,900 |
Source: Public Records
Tax History Compared to Growth
Tax History
| Year | Tax Paid | Tax Assessment Tax Assessment Total Assessment is a certain percentage of the fair market value that is determined by local assessors to be the total taxable value of land and additions on the property. | Land | Improvement |
|---|---|---|---|---|
| 2025 | $3,947 | $743,400 | $219,800 | $523,600 |
| 2024 | $3,947 | $739,900 | $211,700 | $528,200 |
| 2023 | $3,695 | $691,300 | $203,500 | $487,800 |
| 2022 | $3,811 | $701,400 | $199,500 | $501,900 |
| 2021 | $3,432 | $537,800 | $151,400 | $386,400 |
| 2020 | $3,288 | $486,300 | $151,400 | $334,900 |
| 2019 | $3,161 | $456,000 | $142,900 | $313,100 |
| 2018 | $2,970 | $448,100 | $142,900 | $305,200 |
| 2017 | $2,971 | $428,800 | $142,900 | $285,900 |
| 2016 | $2,766 | $386,000 | $128,700 | $257,300 |
| 2015 | $2,590 | $335,100 | $142,900 | $192,200 |
| 2014 | $2,521 | $320,300 | $139,000 | $181,300 |
Source: Public Records
Map
Nearby Homes
- 9171 Strasbourg Cir
- 9130 Maison Dr
- 9123 Meadow Ct
- 9460 S Tramway Dr
- 8888 S Renegade Rd
- 8965 Quail Run Dr
- 9451 S Fox Cir
- 1616 Waters Ln
- 1962 E Bluffside Cir
- 2311 Snow Mountain Dr
- 2509 E Cobblestone Way
- 1924 E Viscounti Cove
- 2495 E Granite Hills Cir
- 1814 E 9800 S
- 1990 E Terra Vista Way
- 8638 Piper Ln
- 1492 E Sandy Hills Dr
- 2103 Kramer Dr
- 2131 Gad Way
- 8483 S Terrace Dr
- 2037 Village Point Way
- 2037 E Village Point Way
- 2055 Village Point Way
- 2055 E Village Point Way
- 9180 S Granville Cir
- 9180 Granville Cir
- 9176 Granville Cir
- 9176 S Granville Cir
- 2046 Village Point Way
- 2054 E Village Point Way
- 2054 Village Point Way
- 2029 Village Point Way
- 2065 Village Point Way
- 2065 E Village Point Way
- 9173 Falcon Cir
- 2036 Village Point Way
- 2036 E Village Point Way
- 9179 Granville Cir
- 2064 E Village Point Way
- 2028 E Village Point Way