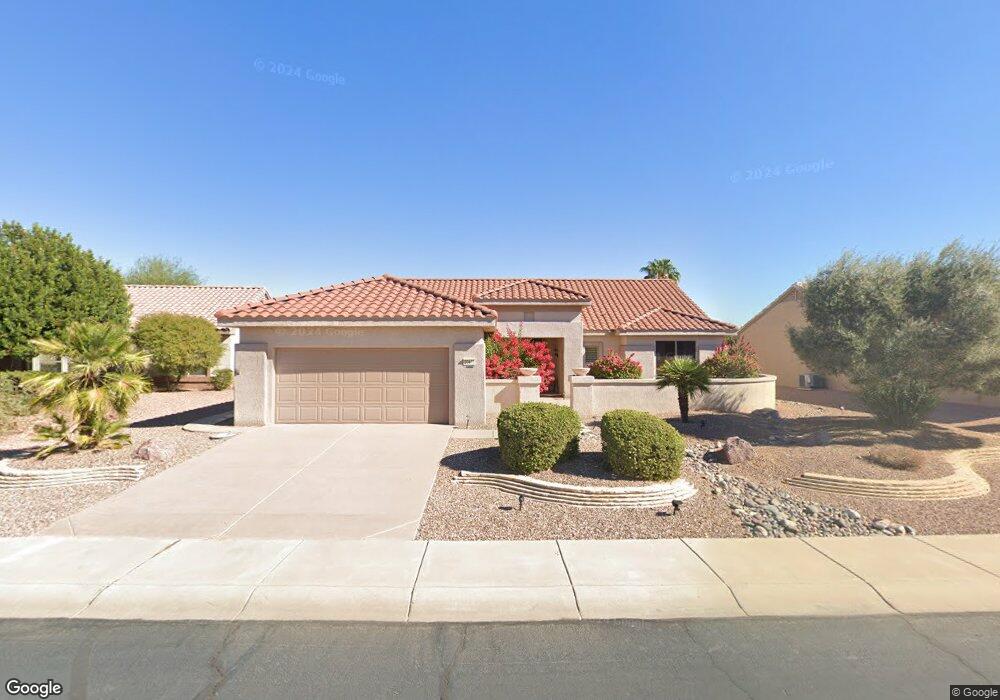
20471 N Wind Drift Way Surprise, AZ 85374
Sun City Grand NeighborhoodEstimated Value: $412,321 - $457,000
--
Bed
2
Baths
1,934
Sq Ft
$228/Sq Ft
Est. Value
About This Home
This home is located at 20471 N Wind Drift Way, Surprise, AZ 85374 and is currently estimated at $441,330, approximately $228 per square foot. 20471 N Wind Drift Way is a home located in Maricopa County with nearby schools including Kingswood Elementary School, Willow Canyon High School, and Cross Christian Academy.
Ownership History
Date
Name
Owned For
Owner Type
Purchase Details
Closed on
Feb 19, 2020
Sold by
Mcardle Fergus J and Mcardle Mary A
Bought by
Mcardle Fergus J and Ralphs Mcardle Mary A
Current Estimated Value
Purchase Details
Closed on
Nov 20, 1998
Sold by
Del Webb Home Construction Inc
Bought by
Del Webb Communities Inc
Home Financials for this Owner
Home Financials are based on the most recent Mortgage that was taken out on this home.
Original Mortgage
$105,000
Outstanding Balance
$21,977
Interest Rate
6.12%
Mortgage Type
New Conventional
Estimated Equity
$419,353
Purchase Details
Closed on
Nov 19, 1998
Sold by
Del Webb Communities Inc
Bought by
Mcardle Fergus J and Mcardle Mary A
Home Financials for this Owner
Home Financials are based on the most recent Mortgage that was taken out on this home.
Original Mortgage
$105,000
Outstanding Balance
$21,977
Interest Rate
6.12%
Mortgage Type
New Conventional
Estimated Equity
$419,353
Create a Home Valuation Report for This Property
The Home Valuation Report is an in-depth analysis detailing your home's value as well as a comparison with similar homes in the area
Home Values in the Area
Average Home Value in this Area
Purchase History
| Date | Buyer | Sale Price | Title Company |
|---|---|---|---|
| Mcardle Fergus J | -- | None Available | |
| Del Webb Communities Inc | -- | Sun City Title Agency | |
| Mcardle Fergus J | $153,305 | Sun City Title Agency |
Source: Public Records
Mortgage History
| Date | Status | Borrower | Loan Amount |
|---|---|---|---|
| Open | Mcardle Fergus J | $105,000 |
Source: Public Records
Tax History Compared to Growth
Tax History
| Year | Tax Paid | Tax Assessment Tax Assessment Total Assessment is a certain percentage of the fair market value that is determined by local assessors to be the total taxable value of land and additions on the property. | Land | Improvement |
|---|---|---|---|---|
| 2025 | $2,419 | $30,956 | -- | -- |
| 2024 | $2,426 | $29,482 | -- | -- |
| 2023 | $2,426 | $34,550 | $6,910 | $27,640 |
| 2022 | $2,409 | $28,920 | $5,780 | $23,140 |
| 2021 | $2,551 | $27,000 | $5,400 | $21,600 |
| 2020 | $2,523 | $25,420 | $5,080 | $20,340 |
| 2019 | $2,452 | $23,100 | $4,620 | $18,480 |
| 2018 | $2,424 | $22,400 | $4,480 | $17,920 |
| 2017 | $2,233 | $21,150 | $4,230 | $16,920 |
| 2016 | $2,155 | $20,170 | $4,030 | $16,140 |
| 2015 | $1,976 | $19,120 | $3,820 | $15,300 |
Source: Public Records
Map
Nearby Homes
- 16045 W Autumn Sage Dr
- 15936 W Kino Dr
- 15819 W Silver Breeze Dr
- 15890 W Autumn Sage Dr
- 16019 W Kino Dr
- 16115 W Acacia Ct
- 15816 W La Paloma Dr
- 20716 N Shadow Mountain Dr
- 15989 W La Paloma Dr
- 15874 W Wildflower Dr
- 20828 N Shadow Mountain Dr
- 15764 W Silver Breeze Dr
- 0 W Wildflower Dr Unit 21 6841798
- 20473 N Desert Sage Ln
- 20418 N Kino Dr
- 20304 N Windy Walk Ct
- 15798 W Cinnabar Dr
- 16108 W Quail Creek Ln
- 20442 N Palm Canyon Dr
- 20234 N Mariposa Way
- 20465 N Wind Drift Way
- 20477 N Wind Drift Way
- 20474 N Ridgewood Ln
- 16013 W Copper Crest Ln
- 20459 N Wind Drift Way
- 20468 N Ridgewood Ln
- 16006 W Copper Crest Ln
- 20472 N Wind Drift Way
- 20480 N Ridgewood Ln
- 20466 N Wind Drift Way
- 16019 W Copper Crest Ln
- 16012 W Copper Crest Ln
- 20453 N Wind Drift Way
- 20460 N Wind Drift Way
- 16018 W Copper Crest Ln
- 16025 W Copper Crest Ln
- 15975 W Autumn Sage Dr
- 15965 W Autumn Sage Dr
- 15985 W Autumn Sage Dr
- 15938 W Silver Breeze Dr