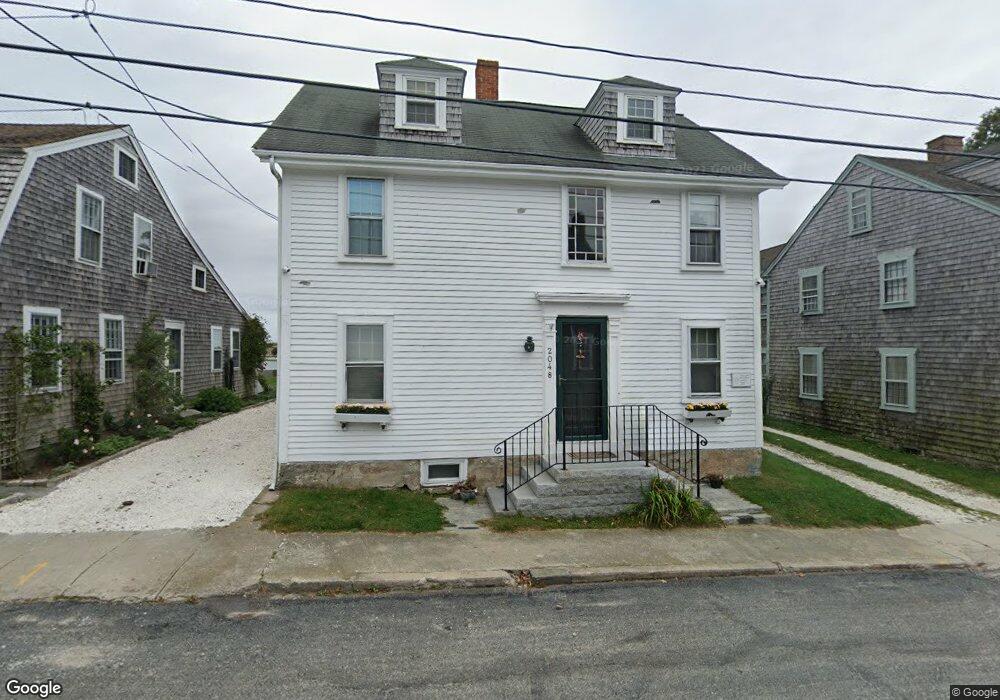
2048 Main Rd Westport Point, MA 02791
Westport Point NeighborhoodEstimated Value: $943,000 - $1,608,000
7
Beds
--
Bath
2,810
Sq Ft
$457/Sq Ft
Est. Value
About This Home
This home is located at 2048 Main Rd, Westport Point, MA 02791 and is currently estimated at $1,284,864, approximately $457 per square foot. 2048 Main Rd is a home with nearby schools including Alice A. Macomber Primary School, Westport Elementary School, and Westport Middle-High School.
Ownership History
Date
Name
Owned For
Owner Type
Purchase Details
Closed on
Mar 19, 2020
Sold by
Paull Point House Nt and Paull
Bought by
Point House 2020 Nt and Paull
Current Estimated Value
Home Financials for this Owner
Home Financials are based on the most recent Mortgage that was taken out on this home.
Original Mortgage
$475,000
Outstanding Balance
$418,961
Interest Rate
3.4%
Mortgage Type
New Conventional
Estimated Equity
$865,903
Purchase Details
Closed on
Sep 7, 2018
Sold by
Paull Jonathan E and Paull Nancy E
Bought by
Paull Point House Nt and Paull
Purchase Details
Closed on
Apr 29, 2015
Sold by
Tongue Dorothy P
Bought by
Old Store Nt and Tongue
Purchase Details
Closed on
May 24, 2013
Sold by
Paull Jonathan E
Bought by
Paull Jonathan E and Paull Nancy E
Purchase Details
Closed on
Dec 15, 2010
Sold by
Point House Llc
Bought by
Paull Jonathan E and Tongue Dorothy P
Create a Home Valuation Report for This Property
The Home Valuation Report is an in-depth analysis detailing your home's value as well as a comparison with similar homes in the area
Home Values in the Area
Average Home Value in this Area
Purchase History
| Date | Buyer | Sale Price | Title Company |
|---|---|---|---|
| Point House 2020 Nt | $460,000 | None Available | |
| Point House 2020 Nt | $460,000 | None Available | |
| Point House 2020 Nt | $460,000 | None Available | |
| Paull Point House Nt | -- | -- | |
| Paull Point House Nt | -- | -- | |
| Paull Point House Nt | -- | -- | |
| Old Store Nt | -- | -- | |
| Old Store Nt | -- | -- | |
| Old Store Nt | -- | -- | |
| Paull Jonathan E | -- | -- | |
| Paull Jonathan E | -- | -- | |
| Paull Jonathan E | -- | -- | |
| Paull Jonathan E | -- | -- | |
| Paull Jonathan E | -- | -- |
Source: Public Records
Mortgage History
| Date | Status | Borrower | Loan Amount |
|---|---|---|---|
| Open | Point House 2020 Nt | $475,000 | |
| Closed | Point House 2020 Nt | $475,000 |
Source: Public Records
Tax History Compared to Growth
Tax History
| Year | Tax Paid | Tax Assessment Tax Assessment Total Assessment is a certain percentage of the fair market value that is determined by local assessors to be the total taxable value of land and additions on the property. | Land | Improvement |
|---|---|---|---|---|
| 2025 | $10,865 | $1,458,400 | $1,071,900 | $386,500 |
| 2024 | $10,301 | $1,332,600 | $948,800 | $383,800 |
| 2023 | $10,021 | $1,228,100 | $903,700 | $324,400 |
| 2022 | $8,890 | $1,048,400 | $819,300 | $229,100 |
| 2021 | $8,036 | $932,300 | $712,000 | $220,300 |
| 2020 | $7,619 | $903,800 | $683,500 | $220,300 |
| 2019 | $7,562 | $914,400 | $683,500 | $230,900 |
| 2018 | $6,789 | $831,000 | $602,900 | $228,100 |
| 2017 | $6,716 | $842,600 | $602,900 | $239,700 |
| 2016 | $6,360 | $804,000 | $586,100 | $217,900 |
| 2015 | $7,012 | $884,200 | $669,800 | $214,400 |
Source: Public Records
Map
Nearby Homes
- 0 Reed Rd (Ss)
- 1881 Main Rd
- 1702J Drift Rd
- 1702 Drift Rd
- 1580 Main Rd
- 19 Seabury Ln
- 238-242 E Beach Rd
- 99 Sylvia Ln
- 189 Brayton Point Rd
- 1346 Main Rd Unit B
- 304 Brayton Point Rd
- Lot 2 Horseneck Rd
- 255 John Dyer Rd
- 245 John Dyer Rd
- 225 Hixbridge Rd
- 17 Quail Trail
- 920 Drift Rd
- Lot 2E Horseneck Rd
- 101 Adamsville Rd
- 18 Old Barn Rd