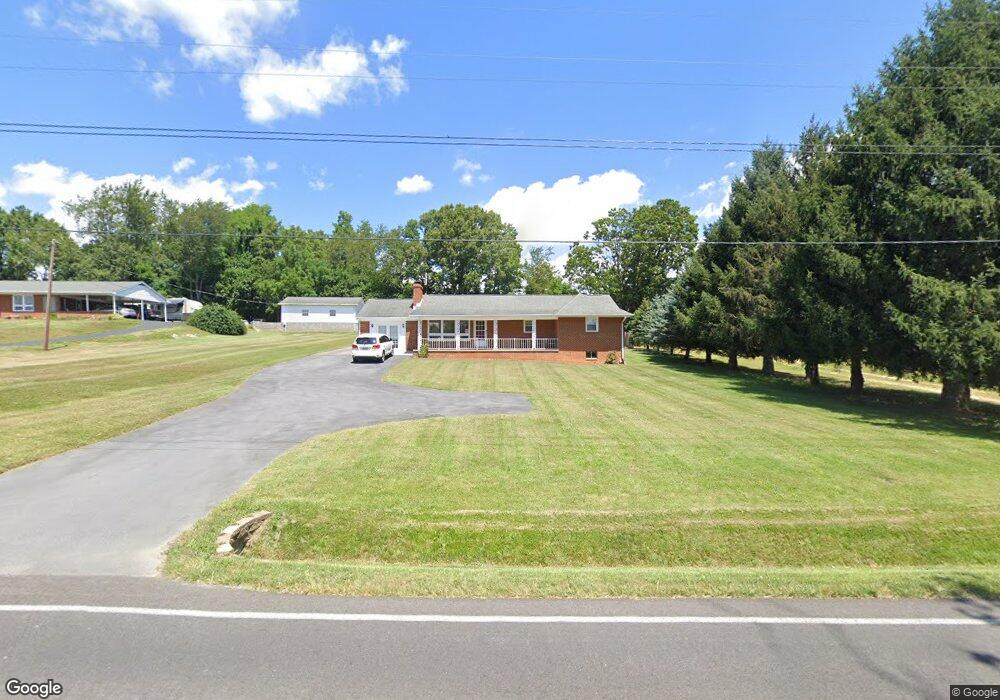
2048 Stuarts Draft Hwy Stuarts Draft, VA 24477
Estimated Value: $309,000 - $382,000
3
Beds
2
Baths
2,963
Sq Ft
$119/Sq Ft
Est. Value
About This Home
This home is located at 2048 Stuarts Draft Hwy, Stuarts Draft, VA 24477 and is currently estimated at $352,365, approximately $118 per square foot. 2048 Stuarts Draft Hwy is a home located in Augusta County with nearby schools including Riverheads Elementary School, Beverley Manor Middle School, and Riverheads High School.
Ownership History
Date
Name
Owned For
Owner Type
Purchase Details
Closed on
Feb 26, 2016
Sold by
Crispin Matthew
Bought by
Shorter Crystal M and Robertson Anthony W
Current Estimated Value
Home Financials for this Owner
Home Financials are based on the most recent Mortgage that was taken out on this home.
Original Mortgage
$132,554
Outstanding Balance
$104,331
Interest Rate
3.81%
Mortgage Type
FHA
Estimated Equity
$248,034
Purchase Details
Closed on
Dec 30, 2004
Sold by
Mcclung Wayne and Mcclung Charlene M
Bought by
Crispin Matthew
Home Financials for this Owner
Home Financials are based on the most recent Mortgage that was taken out on this home.
Original Mortgage
$34,000
Interest Rate
5.14%
Mortgage Type
Stand Alone Second
Create a Home Valuation Report for This Property
The Home Valuation Report is an in-depth analysis detailing your home's value as well as a comparison with similar homes in the area
Purchase History
| Date | Buyer | Sale Price | Title Company |
|---|---|---|---|
| Shorter Crystal M | $135,000 | Attorney | |
| Crispin Matthew | -- | -- |
Source: Public Records
Mortgage History
| Date | Status | Borrower | Loan Amount |
|---|---|---|---|
| Open | Shorter Crystal M | $132,554 | |
| Previous Owner | Crispin Matthew | $34,000 | |
| Previous Owner | Crispin Matthew | $136,000 |
Source: Public Records
Tax History
| Year | Tax Paid | Tax Assessment Tax Assessment Total Assessment is a certain percentage of the fair market value that is determined by local assessors to be the total taxable value of land and additions on the property. | Land | Improvement |
|---|---|---|---|---|
| 2025 | $1,703 | $327,500 | $55,000 | $272,500 |
| 2024 | $1,703 | $327,500 | $55,000 | $272,500 |
| 2023 | $1,392 | $220,900 | $32,500 | $188,400 |
| 2022 | $1,392 | $220,900 | $32,500 | $188,400 |
| 2021 | $1,392 | $220,900 | $32,500 | $188,400 |
| 2020 | $1,392 | $220,900 | $32,500 | $188,400 |
| 2019 | $1,392 | $220,900 | $32,500 | $188,400 |
| 2018 | $1,307 | $207,431 | $32,500 | $174,931 |
| 2017 | $1,203 | $207,431 | $32,500 | $174,931 |
| 2016 | $1,203 | $207,431 | $32,500 | $174,931 |
| 2015 | $1,044 | $207,431 | $32,500 | $174,931 |
| 2014 | $1,044 | $207,431 | $32,500 | $174,931 |
| 2013 | $1,044 | $217,600 | $50,000 | $167,600 |
Source: Public Records
Map
Nearby Homes
- 911 Old White Hill Rd
- 000 Stuarts Draft Hwy
- 14 Lookover Terrace
- 157 Lookover Terrace
- 86 Lookover Terrace
- 98 Rebecca Ct
- 1800 Stuarts Draft Hwy
- 0 Johnson Dr Unit 663189
- 241 Bowmans Run Dr
- 1636 Stuarts Draft Hwy
- 1448 Stuarts Draft Hwy
- 2735 Stuarts Draft Hwy
- 81 Meriwether Cir
- 153 Sylvan Dr
- TBD Howardsville Turnpike
- TBD Churchmans Mill Rd
- TBD Gerties Ln
- 0 Kiley Ln Unit 569156
- tbd Mill Creek Ln
- TBD Cold Springs Rd
- 2054 Stuarts Draft Hwy
- 2040 Stuarts Draft Hwy
- 939 Old White Hill Rd
- 933 Old White Hill Rd
- 2014 Stuarts Draft Hwy
- 927 Old White Hill Rd
- 2083 Stuarts Draft Hwy
- 917 Old White Hill Rd
- 38 Jays Ln
- 2094 Stuarts Draft Hwy Unit 83 A 36-41
- 2094 Stuarts Draft Hwy
- 952 Old White Hill Rd
- 2004 Stuarts Draft Hwy
- 924 Old White Hill Rd
- 966 Old White Hill Rd
- 2005 Stuarts Draft Hwy
- 7 Friendship Ln
- 908 Old White Hill Rd
- 54 Jays Ln
- 1996 Stuarts Draft Hwy
Your Personal Tour Guide
Ask me questions while you tour the home.