Estimated Value: $714,860 - $809,000
5
Beds
4
Baths
1,896
Sq Ft
$403/Sq Ft
Est. Value
About This Home
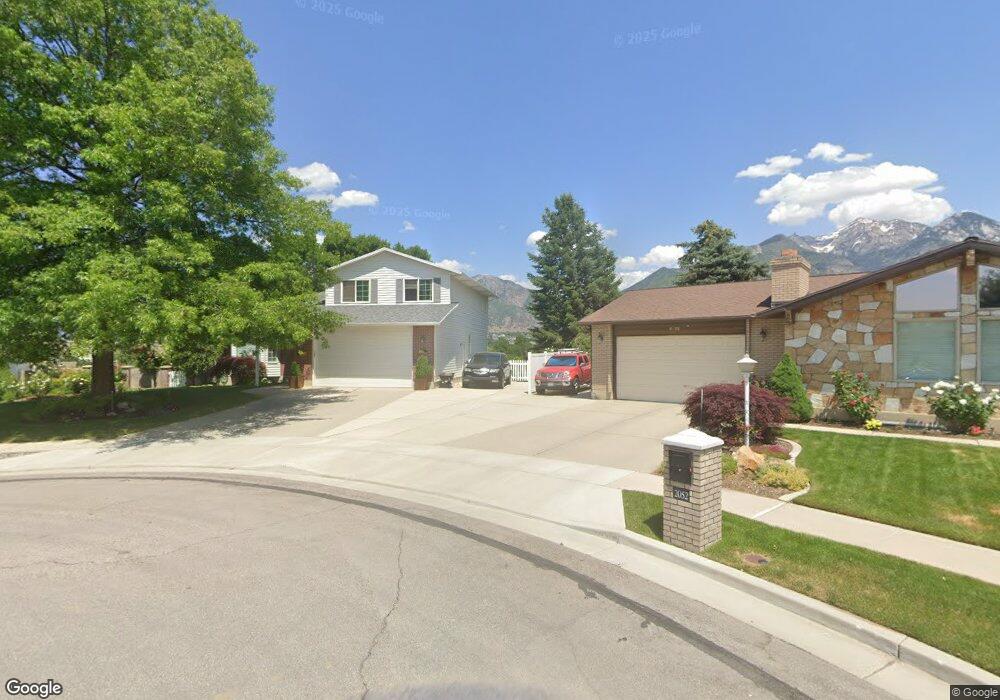
This home is located at 2049 Brady Creek Cir, Sandy, UT 84093 and is currently estimated at $764,965, approximately $403 per square foot. 2049 Brady Creek Cir is a home located in Salt Lake County with nearby schools including Oakdale School, Albion Middle School, and Hillcrest High School.
Ownership History
Date
Name
Owned For
Owner Type
Purchase Details
Closed on
Sep 28, 2015
Sold by
Landerman Janet L
Bought by
Landerman Richard C and Landerman Janet L
Current Estimated Value
Purchase Details
Closed on
Aug 4, 2015
Sold by
Dickey Jeanne H
Bought by
Landerman Janet L
Purchase Details
Closed on
Mar 15, 1995
Sold by
Henderson L M and Henderson Maurine C
Bought by
Henderson Lavell Merl and Henderson Maurine C
Create a Home Valuation Report for This Property
The Home Valuation Report is an in-depth analysis detailing your home's value as well as a comparison with similar homes in the area
Home Values in the Area
Average Home Value in this Area
Purchase History
| Date | Buyer | Sale Price | Title Company |
|---|---|---|---|
| Landerman Richard C | -- | None Available | |
| Landerman Janet L | -- | None Available | |
| Dickey Jeanne H | -- | None Available | |
| Henderson Lavell Merl | -- | -- |
Source: Public Records
Tax History Compared to Growth
Tax History
| Year | Tax Paid | Tax Assessment Tax Assessment Total Assessment is a certain percentage of the fair market value that is determined by local assessors to be the total taxable value of land and additions on the property. | Land | Improvement |
|---|---|---|---|---|
| 2025 | $3,330 | $687,600 | $264,000 | $423,600 |
| 2024 | $3,330 | $624,200 | $254,100 | $370,100 |
| 2023 | $3,122 | $584,200 | $244,400 | $339,800 |
| 2022 | $3,152 | $580,200 | $239,600 | $340,600 |
| 2021 | $2,746 | $430,300 | $186,500 | $243,800 |
| 2020 | $2,589 | $382,800 | $186,500 | $196,300 |
| 2019 | $2,406 | $347,200 | $176,000 | $171,200 |
| 2018 | $0 | $330,800 | $176,000 | $154,800 |
| 2017 | $2,006 | $289,600 | $176,000 | $113,600 |
| 2016 | $1,825 | $254,700 | $158,600 | $96,100 |
| 2015 | -- | $278,400 | $188,500 | $89,900 |
| 2014 | $2,078 | $264,000 | $183,400 | $80,600 |
Source: Public Records
Map
Nearby Homes
- 8483 S Terrace Dr
- 2131 Gad Way
- 1990 E Terra Vista Way
- 8571 Monitor Dr
- 1924 E Viscounti Cove
- 2311 Snow Mountain Dr
- 8638 Piper Ln
- 2161 E Lorita Way
- 2271 E Alta Canyon Cir
- 8888 S Renegade Rd
- 1666 Paulista Way
- 2238 Cottonwood Cove Ln
- 1597 Paulista Way
- 8965 Quail Run Dr
- 8585 Mount Majestic Rd
- 8597 Mount Majestic Rd
- 9130 Maison Dr
- 9123 Meadow Ct
- 7820 Nantucket Dr
- 2614 E Tuxedo Cir
- 2043 Brady Creek Cir
- 2052 Brady Creek Cir
- 2046 Leonard Cir
- 2046 E Leonard Cir
- 7849 Brady Creek Cir
- 7851 Brady Creek Cir
- 2038 Leonard Cir
- 2048 Brady Creek Cir
- 2031 Brady Creek Cir
- 2040 Brady Creek Cir
- 2050 Leonard Cir
- 8427 Terrace Dr
- 8426 S Gad Way
- 8438 S Gad Way
- 2020 Leonard Cir
- 2053 E Corrie Ann Cir
- 2047 Corrie Ann Cir
- 2053 Corrie Ann Cir
- 2045 Leonard Cir
- 8438 S Gad Way