Estimated Value: $112,000 - $163,000
2
Beds
2
Baths
1,192
Sq Ft
$112/Sq Ft
Est. Value
About This Home
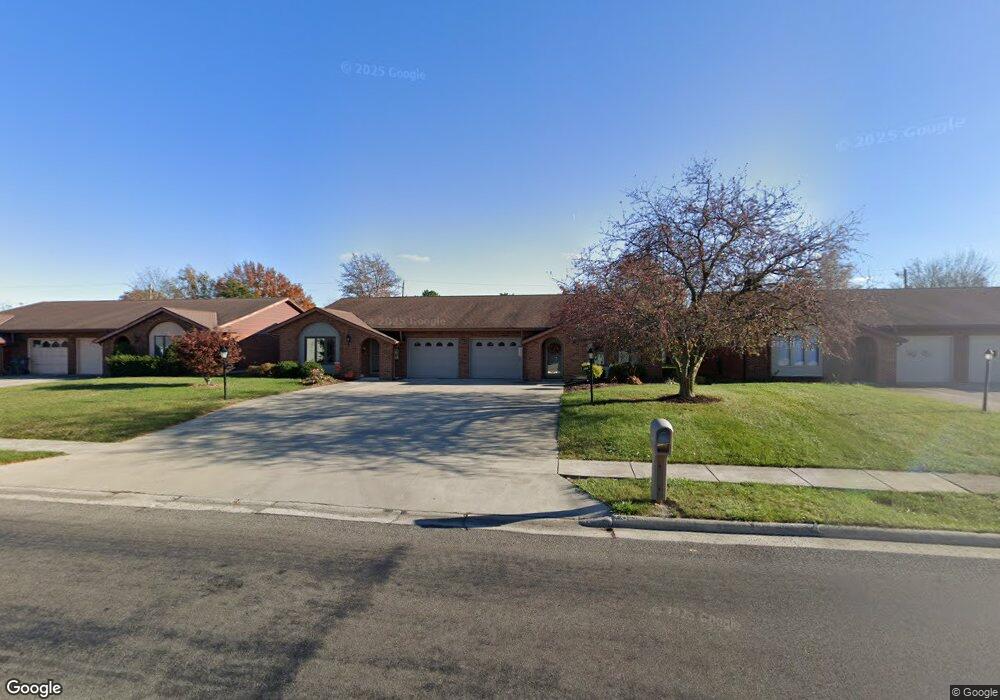
This home is located at 2049 Edgewood Dr, Lima, OH 45805 and is currently estimated at $133,544, approximately $112 per square foot. 2049 Edgewood Dr is a home located in Allen County with nearby schools including Elida Elementary School, Elida Middle School, and Elida High School.
Ownership History
Date
Name
Owned For
Owner Type
Purchase Details
Closed on
Jan 12, 2022
Sold by
Colvin Brandon E and Colvin Connie
Bought by
Red Carpet Rental Prop Llc
Current Estimated Value
Purchase Details
Closed on
Oct 28, 2021
Bought by
Brandon E Colvin
Home Financials for this Owner
Home Financials are based on the most recent Mortgage that was taken out on this home.
Interest Rate
3.14%
Purchase Details
Closed on
Feb 20, 2020
Sold by
Clark David L and Clark Tanya K
Bought by
Hudson Erma Ruth
Purchase Details
Closed on
Jun 9, 2014
Sold by
Clark David L and Clark Tanya K
Bought by
Clark David L and Clark Tanya K
Purchase Details
Closed on
Nov 27, 2002
Sold by
Sawmiller Daryl L
Bought by
Clark Tanya K
Purchase Details
Closed on
Jul 27, 1990
Bought by
Sawmiller Helen L
Create a Home Valuation Report for This Property
The Home Valuation Report is an in-depth analysis detailing your home's value as well as a comparison with similar homes in the area
Purchase History
| Date | Buyer | Sale Price | Title Company |
|---|---|---|---|
| Red Carpet Rental Prop Llc | -- | None Listed On Document | |
| Brandon E Colvin | $185,500 | -- | |
| Hudson Erma Ruth | $154,500 | None Available | |
| Clark David L | -- | None Available | |
| Clark Tanya K | $37,500 | -- | |
| Sawmiller Helen L | $51,900 | -- |
Source: Public Records
Mortgage History
| Date | Status | Borrower | Loan Amount |
|---|---|---|---|
| Previous Owner | Brandon E Colvin | -- |
Source: Public Records
Tax History
| Year | Tax Paid | Tax Assessment Tax Assessment Total Assessment is a certain percentage of the fair market value that is determined by local assessors to be the total taxable value of land and additions on the property. | Land | Improvement |
|---|---|---|---|---|
| 2024 | $1,524 | $33,920 | $4,690 | $29,230 |
| 2023 | $1,402 | $27,590 | $3,820 | $23,770 |
| 2022 | $1,441 | $27,590 | $3,820 | $23,770 |
| 2021 | $1,684 | $27,590 | $3,820 | $23,770 |
| 2020 | $1,362 | $24,580 | $3,820 | $20,760 |
| 2019 | $1,362 | $24,580 | $3,820 | $20,760 |
| 2018 | $1,272 | $24,580 | $3,820 | $20,760 |
| 2017 | $1,169 | $21,360 | $3,820 | $17,540 |
| 2016 | $708 | $21,360 | $3,820 | $17,540 |
| 2015 | $1,159 | $21,360 | $3,820 | $17,540 |
| 2014 | $694 | $21,460 | $3,500 | $17,960 |
| 2013 | $624 | $21,460 | $3,500 | $17,960 |
Source: Public Records
Map
Nearby Homes
- 1919 Jared Place
- 2225 N Cable Rd
- 2129 Reinell Ave
- 2113 Kimberly Dr
- 00 Homeward Ave
- 2275 N Cable Rd Unit 178
- 2275 N Cable Rd Unit 130
- 2275 N Cable Rd Unit 43 Unit Package
- 2275 N Cable Rd Unit 42
- 2275 N Cable Rd Unit 12
- 2275 N Cable Rd Unit 24
- 2275 N Cable Rd Unit 1
- 2275 N Cable Rd
- 2275 N Cable Rd Unit 97
- 2275 N Cable Rd Unit 98
- 2275 N Cable Rd Unit 137
- 1730 Homeward Ave
- 1883 Brookhaven Dr Unit 2
- 1743 Sherry Lee Dr
- 2630 Carolyn Dr
- 2047 Edgewood Dr
- 2033 Edgewood Dr
- 2035 Edgewood Dr
- 2050 Edgewood Dr
- 2019 Edgewood Dr
- 2036 Edgewood Dr
- 2075 Edgewood Dr
- 2064 Edgewood Dr
- 2018 Edgewood Dr
- 2005 Edgewood Dr
- 2076 Edgewood Dr
- 2089 Edgewood Dr
- 239 Hartford Ct Unit 1A
- 241 Hartford Ct
- 243 Hartford Ct Unit 1C
- 2205 Juneau Dr
- 236 Hartford Ct Unit A
Your Personal Tour Guide
Ask me questions while you tour the home.