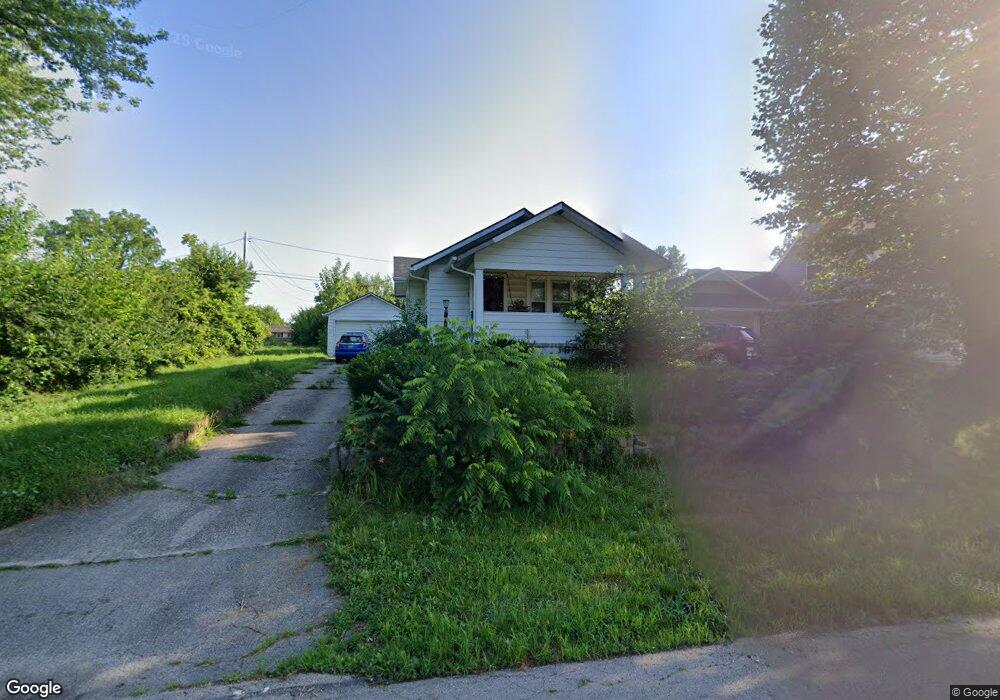
2049 Maplegrove Ave Dayton, OH 45414
Northridge NeighborhoodEstimated Value: $86,000 - $158,000
3
Beds
1
Bath
968
Sq Ft
$123/Sq Ft
Est. Value
About This Home
This home is located at 2049 Maplegrove Ave, Dayton, OH 45414 and is currently estimated at $118,611, approximately $122 per square foot. 2049 Maplegrove Ave is a home located in Montgomery County with nearby schools including Northridge High School, Deca Prep, and Horizon Science Academy-Dayton Elementary School.
Ownership History
Date
Name
Owned For
Owner Type
Purchase Details
Closed on
Dec 13, 2010
Sold by
Fannie Mae
Bought by
Arrasmith Linda A
Current Estimated Value
Purchase Details
Closed on
Sep 8, 2010
Sold by
Walters George Allen
Bought by
Federal National Mortgage Association
Purchase Details
Closed on
May 11, 2007
Sold by
Dakin Robert Patrick
Bought by
Walters George Allen
Home Financials for this Owner
Home Financials are based on the most recent Mortgage that was taken out on this home.
Original Mortgage
$72,250
Interest Rate
6.27%
Mortgage Type
Purchase Money Mortgage
Purchase Details
Closed on
Jan 24, 2007
Sold by
Fannie Mae
Bought by
Dakin Robert Patrick
Purchase Details
Closed on
Mar 2, 2006
Sold by
Baber Rodney E
Bought by
Federal National Mortgage Association
Create a Home Valuation Report for This Property
The Home Valuation Report is an in-depth analysis detailing your home's value as well as a comparison with similar homes in the area
Home Values in the Area
Average Home Value in this Area
Purchase History
| Date | Buyer | Sale Price | Title Company |
|---|---|---|---|
| Arrasmith Linda A | $19,900 | Accutitle Agency Inc | |
| Federal National Mortgage Association | $30,000 | None Available | |
| Walters George Allen | $85,000 | Attorney | |
| Dakin Robert Patrick | $25,000 | None Available | |
| Federal National Mortgage Association | $34,000 | None Available |
Source: Public Records
Mortgage History
| Date | Status | Borrower | Loan Amount |
|---|---|---|---|
| Previous Owner | Walters George Allen | $72,250 |
Source: Public Records
Tax History Compared to Growth
Tax History
| Year | Tax Paid | Tax Assessment Tax Assessment Total Assessment is a certain percentage of the fair market value that is determined by local assessors to be the total taxable value of land and additions on the property. | Land | Improvement |
|---|---|---|---|---|
| 2024 | $1,903 | $21,270 | $4,780 | $16,490 |
| 2023 | $1,903 | $21,270 | $4,780 | $16,490 |
| 2022 | $1,664 | $15,530 | $3,490 | $12,040 |
| 2021 | $1,636 | $15,530 | $3,490 | $12,040 |
| 2020 | $1,634 | $15,530 | $3,490 | $12,040 |
| 2019 | $1,538 | $13,060 | $3,870 | $9,190 |
| 2018 | $1,540 | $13,060 | $3,870 | $9,190 |
| 2017 | $1,532 | $13,060 | $3,870 | $9,190 |
| 2016 | $1,451 | $12,310 | $3,870 | $8,440 |
| 2015 | $1,307 | $12,310 | $3,870 | $8,440 |
| 2014 | $1,307 | $12,310 | $3,870 | $8,440 |
| 2012 | -- | $17,260 | $4,910 | $12,350 |
Source: Public Records
Map
Nearby Homes
- 2059 Neff Rd
- 2124 Lodell Ave
- 2417 Neff Rd
- 3394 Lodge Ave Unit 3384
- 1640 Pinecrest Dr
- 3865 Hillmont Ave
- 2171 Argray Dr
- 4400 Canyon Rd
- 2320 Ottello Ave
- 4404 Ross Ave
- 2233 Ottello Ave
- 2585 Coronette Ave
- 2412 Neva Dr
- 2424 Ottello Ave
- 2422 Oneida Ave
- 1904 Edgeworth Ave
- 2039 Ontario Ave
- 3043 Idylwilde Blvd
- 1902 Ontario Ave
- 2139 Ome Ave
- 2051 Maplegrove Ave
- 2041 Maplegrove Ave
- 2050 Neff Rd
- 2055 Maplegrove Ave
- 2035 Maplegrove Ave
- 2056 Neff Rd
- 2046 Neff Rd
- 2050 Maplegrove Ave
- 0 Maplegrove Ave Unit 394786
- 2038 Neff Rd
- 2054 Maplegrove Ave
- 2036 Maplegrove Ave
- 2059 Maplegrove Ave
- 2031 Maplegrove Ave
- 2092 Neff Rd
- 2032 Neff Rd
- 2032 Maplegrove Ave
- 2058 Maplegrove Ave
- 2027 Maplegrove Ave
- 2071 Neff Rd