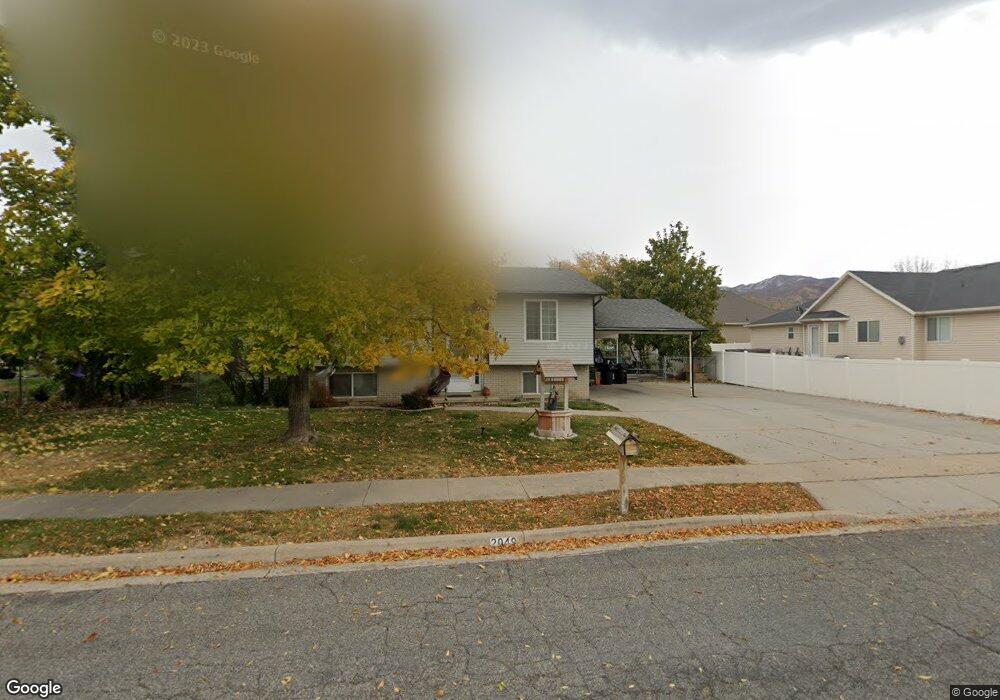
2049 S 865 W Woods Cross, UT 84087
Estimated Value: $466,000 - $517,000
4
Beds
2
Baths
2,042
Sq Ft
$237/Sq Ft
Est. Value
About This Home
This home is located at 2049 S 865 W, Woods Cross, UT 84087 and is currently estimated at $484,750, approximately $237 per square foot. 2049 S 865 W is a home located in Davis County with nearby schools including Woods Cross Elementary School, South Davis Junior High School, and Woods Cross High School.
Ownership History
Date
Name
Owned For
Owner Type
Purchase Details
Closed on
Nov 14, 2016
Sold by
Evans Zackery K and Evans Carrie A
Bought by
Evans Richard K and Evans Bradley S
Current Estimated Value
Purchase Details
Closed on
Jan 10, 2012
Sold by
Haynie Aram and Haynie Corri
Bought by
Evans Zackery K and Evans Carrie A
Home Financials for this Owner
Home Financials are based on the most recent Mortgage that was taken out on this home.
Original Mortgage
$123,750
Outstanding Balance
$84,450
Interest Rate
3.96%
Mortgage Type
New Conventional
Estimated Equity
$400,300
Purchase Details
Closed on
May 24, 2001
Sold by
Smouse Russell W and Smouse Liliana
Bought by
Haynie Aram and Haynie Corri
Home Financials for this Owner
Home Financials are based on the most recent Mortgage that was taken out on this home.
Original Mortgage
$135,375
Interest Rate
7.06%
Mortgage Type
FHA
Create a Home Valuation Report for This Property
The Home Valuation Report is an in-depth analysis detailing your home's value as well as a comparison with similar homes in the area
Home Values in the Area
Average Home Value in this Area
Purchase History
| Date | Buyer | Sale Price | Title Company |
|---|---|---|---|
| Evans Richard K | -- | Stewart Title | |
| Evans Zackery K | -- | Bonneville Superior T | |
| Haynie Aram | -- | Backman Stewart Title Servic |
Source: Public Records
Mortgage History
| Date | Status | Borrower | Loan Amount |
|---|---|---|---|
| Open | Evans Zackery K | $123,750 | |
| Previous Owner | Haynie Aram | $135,375 |
Source: Public Records
Tax History Compared to Growth
Tax History
| Year | Tax Paid | Tax Assessment Tax Assessment Total Assessment is a certain percentage of the fair market value that is determined by local assessors to be the total taxable value of land and additions on the property. | Land | Improvement |
|---|---|---|---|---|
| 2025 | $2,554 | $222,750 | $113,369 | $109,381 |
| 2024 | $2,451 | $218,900 | $121,213 | $97,687 |
| 2023 | $2,336 | $388,000 | $160,874 | $227,126 |
| 2022 | $2,309 | $212,850 | $69,900 | $142,950 |
| 2021 | $2,098 | $308,000 | $102,699 | $205,301 |
| 2020 | $1,867 | $271,000 | $97,789 | $173,211 |
| 2019 | $1,853 | $265,000 | $91,108 | $173,892 |
| 2018 | $1,738 | $247,000 | $89,565 | $157,435 |
| 2016 | $1,445 | $111,595 | $38,596 | $72,999 |
| 2015 | $1,363 | $101,530 | $38,596 | $62,934 |
| 2014 | $1,417 | $108,695 | $38,596 | $70,099 |
| 2013 | -- | $92,238 | $24,798 | $67,440 |
Source: Public Records
Map
Nearby Homes