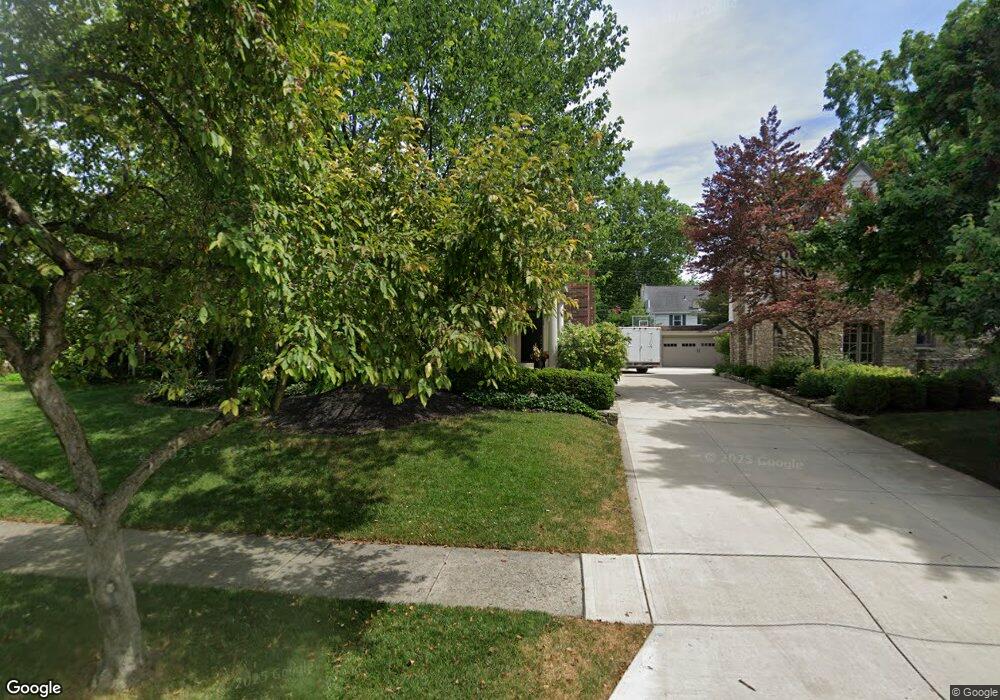
2049 Westover Rd Columbus, OH 43221
Estimated Value: $1,061,000 - $1,291,000
4
Beds
4
Baths
2,802
Sq Ft
$413/Sq Ft
Est. Value
About This Home
This home is located at 2049 Westover Rd, Columbus, OH 43221 and is currently estimated at $1,157,420, approximately $413 per square foot. 2049 Westover Rd is a home located in Franklin County with nearby schools including Barrington Road Elementary School, Jones Middle School, and Upper Arlington High School.
Ownership History
Date
Name
Owned For
Owner Type
Purchase Details
Closed on
Aug 24, 2011
Sold by
Heller John H and Heller Elizabeth T
Bought by
Quick Adam D and Quick Allison M
Current Estimated Value
Home Financials for this Owner
Home Financials are based on the most recent Mortgage that was taken out on this home.
Original Mortgage
$532,000
Outstanding Balance
$368,522
Interest Rate
4.58%
Mortgage Type
New Conventional
Estimated Equity
$788,898
Purchase Details
Closed on
Oct 20, 2004
Sold by
Heller John H and Heller Elizabeth T
Bought by
Heller John H and Heller Elizabeth T
Home Financials for this Owner
Home Financials are based on the most recent Mortgage that was taken out on this home.
Original Mortgage
$564,000
Interest Rate
5.81%
Mortgage Type
Purchase Money Mortgage
Purchase Details
Closed on
Apr 2, 1984
Bought by
Heller John H
Purchase Details
Closed on
Nov 1, 1979
Create a Home Valuation Report for This Property
The Home Valuation Report is an in-depth analysis detailing your home's value as well as a comparison with similar homes in the area
Home Values in the Area
Average Home Value in this Area
Purchase History
| Date | Buyer | Sale Price | Title Company |
|---|---|---|---|
| Quick Adam D | $665,000 | Stewart | |
| Heller John H | -- | Title First | |
| Heller John H | $110,000 | -- | |
| -- | $80,500 | -- |
Source: Public Records
Mortgage History
| Date | Status | Borrower | Loan Amount |
|---|---|---|---|
| Open | Quick Adam D | $532,000 | |
| Closed | Heller John H | $564,000 |
Source: Public Records
Tax History Compared to Growth
Tax History
| Year | Tax Paid | Tax Assessment Tax Assessment Total Assessment is a certain percentage of the fair market value that is determined by local assessors to be the total taxable value of land and additions on the property. | Land | Improvement |
|---|---|---|---|---|
| 2024 | $18,401 | $317,840 | $121,280 | $196,560 |
| 2023 | $18,194 | $317,840 | $121,280 | $196,560 |
| 2022 | $16,235 | $232,330 | $66,150 | $166,180 |
| 2021 | $14,371 | $232,330 | $66,150 | $166,180 |
| 2020 | $14,244 | $232,330 | $66,150 | $166,180 |
| 2019 | $14,116 | $203,560 | $66,150 | $137,410 |
| 2018 | $14,369 | $203,560 | $66,150 | $137,410 |
| 2017 | $14,362 | $203,560 | $66,150 | $137,410 |
| 2016 | $14,716 | $222,570 | $64,190 | $158,380 |
| 2015 | $14,703 | $222,570 | $64,190 | $158,380 |
| 2014 | $14,720 | $222,570 | $64,190 | $158,380 |
| 2013 | $7,029 | $202,335 | $58,345 | $143,990 |
Source: Public Records
Map
Nearby Homes
- 2063 Westover Rd
- 1932 Suffolk Rd Unit 1932
- 2276 Northwest Blvd
- 2593 Coventry Rd
- 2295 Oxford Rd
- 2615 Northwest Blvd
- 2569 Chester Rd
- 2110 Northwest Blvd
- 2585 Westmont Blvd
- 1565 Berkshire Rd
- 1934 Bedford Rd
- 2648 Chester Rd
- 1535 Doone Rd
- 1550 College Hill Dr
- 1481 Doone Rd
- 1488 Essex Rd
- 1470 Cardiff Rd
- 2027-2033 Ridgeview Rd
- 1909 Inchcliff Rd
- 1659 Tremont Rd
- 2057 Westover Rd
- 2041 Westover Rd
- 2032 Wickford Rd
- 2040 Wickford Rd
- 2026 Wickford Rd
- 2360 Southway Dr
- 2359 Coventry Rd
- 2071 Westover Rd
- 2048 Wickford Rd
- 2343 Coventry Rd
- 2368 Southway Dr
- 2036 Westover Rd
- 2054 Wickford Rd
- 2357 Southway Dr
- 2077 Westover Rd
- 2060 Wickford Rd
- 2385 Coventry Rd
- 2376 Southway Dr
- 2029 Wickford Rd
- 2367 Southway Dr