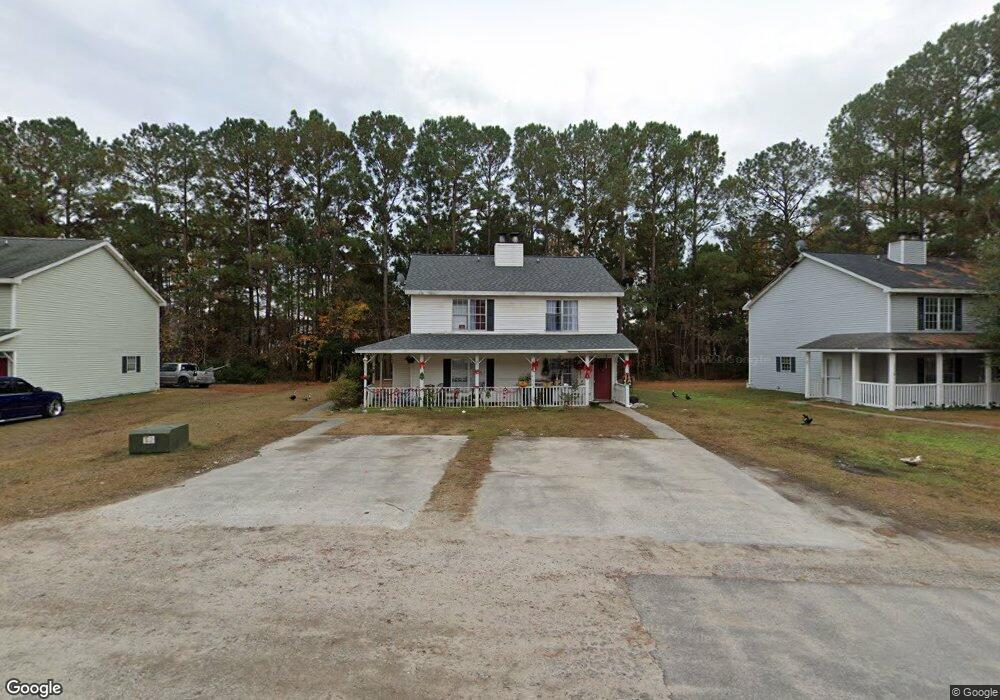
204F Plantation Rd Myrtle Beach, SC 29588
Estimated Value: $152,000 - $174,086
3
Beds
2
Baths
1,200
Sq Ft
$136/Sq Ft
Est. Value
About This Home
This home is located at 204F Plantation Rd, Myrtle Beach, SC 29588 and is currently estimated at $163,022, approximately $135 per square foot. 204F Plantation Rd is a home located in Horry County with nearby schools including Socastee Elementary School, Forestbrook Middle School, and Socastee High School.
Ownership History
Date
Name
Owned For
Owner Type
Purchase Details
Closed on
Mar 4, 2021
Sold by
Yildirim Serdar Sitki
Bought by
Yildirim Canan
Current Estimated Value
Purchase Details
Closed on
Dec 21, 2018
Sold by
Yildirim Serdar Sitki
Bought by
Yildirim Serdar Sitki and Canan
Purchase Details
Closed on
Dec 6, 2017
Sold by
Arentz Julie
Bought by
Yildirim Serdar Sitki
Purchase Details
Closed on
Dec 18, 2012
Sold by
Hughes John D
Bought by
Arentz Julie
Purchase Details
Closed on
Apr 20, 2012
Sold by
Burke John Edmund
Bought by
Hughes John D
Purchase Details
Closed on
Jun 4, 2009
Sold by
Hughes John D
Bought by
Burke John Edmund
Purchase Details
Closed on
Jun 13, 2000
Sold by
Mariel Rene and Mariel Linda
Bought by
Hughes John D and Hughes Doris J
Home Financials for this Owner
Home Financials are based on the most recent Mortgage that was taken out on this home.
Original Mortgage
$65,700
Interest Rate
8.5%
Mortgage Type
Unknown
Create a Home Valuation Report for This Property
The Home Valuation Report is an in-depth analysis detailing your home's value as well as a comparison with similar homes in the area
Home Values in the Area
Average Home Value in this Area
Purchase History
| Date | Buyer | Sale Price | Title Company |
|---|---|---|---|
| Yildirim Canan | -- | -- | |
| Yildirim Serdar Sitki | -- | -- | |
| Yildirim Serdar Sitki | $73,000 | -- | |
| Arentz Julie | $57,100 | -- | |
| Hughes John D | -- | -- | |
| Burke John Edmund | $72,500 | -- | |
| Hughes John D | $73,000 | -- |
Source: Public Records
Mortgage History
| Date | Status | Borrower | Loan Amount |
|---|---|---|---|
| Previous Owner | Hughes John D | $65,700 |
Source: Public Records
Tax History Compared to Growth
Tax History
| Year | Tax Paid | Tax Assessment Tax Assessment Total Assessment is a certain percentage of the fair market value that is determined by local assessors to be the total taxable value of land and additions on the property. | Land | Improvement |
|---|---|---|---|---|
| 2024 | $1,919 | $10,200 | $0 | $10,200 |
| 2023 | $1,919 | $10,080 | $0 | $10,080 |
| 2021 | $1,772 | $10,080 | $0 | $10,080 |
| 2020 | $1,226 | $10,080 | $0 | $10,080 |
| 2019 | $1,226 | $10,080 | $0 | $10,080 |
| 2018 | $938 | $7,350 | $0 | $7,350 |
| 2017 | $757 | $3,420 | $0 | $3,420 |
| 2016 | -- | $3,420 | $0 | $3,420 |
| 2015 | $757 | $5,985 | $0 | $5,985 |
| 2014 | $732 | $3,420 | $0 | $3,420 |
Source: Public Records
Map
Nearby Homes
- 220 Rice Mill Dr
- 489 Wallingford Cir
- 486 Wallingford Cir
- 71 Plantation Rd
- 424 Wallingford Cir
- 215 Tibton Cir
- 4008 Braid Ct
- 105 Old Carriage Ct
- Parcel "A" Palmetto Pointe Blvd
- 2 Sioux Trail
- 121 Olde Towne Way Unit 2
- 109 Old Town Way Unit 4
- 408 Highland Ridge Dr
- 4 Plantation Rd
- 4641 Socastee Blvd Unit D1
- 609 Glen Haven Dr
- 140 Olde Towne Way Unit 2
- 140 Olde Towne Way Unit 1
- 157 Olde Towne Way Unit 4
- 303 Clear Creek Cir
- 204C Plantation Rd
- 206 Plantation Rd Unit A
- 203 Plantation Rd Unit C3
- 203 Plantation Rd Unit A2
- 203 Plantation Rd Unit F1
- 203 Plantation Rd Unit A
- 203 Plantation Rd
- 204 Plantation Rd Unit A
- 204E Plantation Rd
- 204D Plantation Rd
- 204 Plantation Rd Unit A
- 205 Plantation Rd Unit s A and B Cimerr
- 205 Plantation Rd
- 205 Plantation Rd Unit 205 Townes Dr.
- 208 Plantation Rd Unit A
- 201 Plantation Rd Unit A1
- 211A Townes Ct
- 202 Plantation Rd Unit A
- 228 planta Road
- 213 Plantation Rd