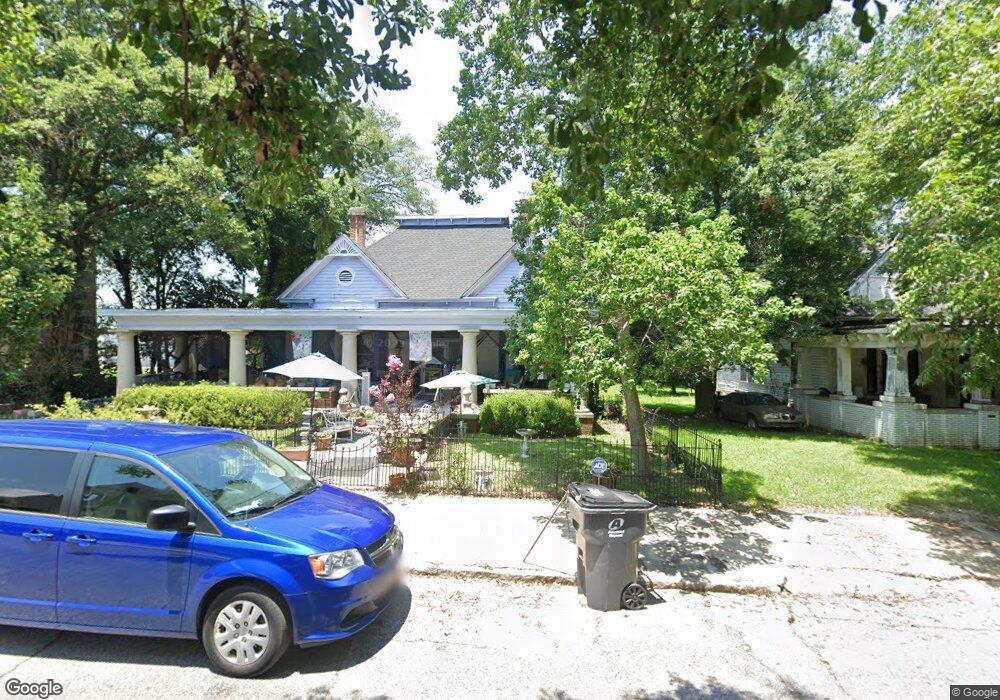
205 11th Ave E Cordele, GA 31015
Estimated Value: $53,000 - $186,823
3
Beds
2
Baths
2,642
Sq Ft
$44/Sq Ft
Est. Value
About This Home
This home is located at 205 11th Ave E, Cordele, GA 31015 and is currently estimated at $116,206, approximately $43 per square foot. 205 11th Ave E is a home located in Crisp County with nearby schools including Crisp County Elementary School, Crisp County Primary School, and Crisp County Middle School.
Ownership History
Date
Name
Owned For
Owner Type
Purchase Details
Closed on
Sep 20, 2010
Sold by
Nationstar Mortgage Llc
Bought by
Beauchamp Peggy Jo
Current Estimated Value
Purchase Details
Closed on
Mar 2, 2010
Sold by
Nipper Shannon M
Bought by
Nationstar Mortgage Llc and Centex Home Equity Company Llc
Purchase Details
Closed on
Jan 1, 2010
Sold by
Nationstar Mortgage Llc
Bought by
Nationstar Mortgage Llc
Purchase Details
Closed on
Oct 27, 2003
Sold by
Buchanan Deborah
Bought by
Nipper Timothy A and Nipper Shannon M
Purchase Details
Closed on
Mar 28, 2003
Sold by
Buchanan Samuel Scott
Bought by
Nipper Timothy A and Nipper Shannon N
Purchase Details
Closed on
Jan 21, 1997
Sold by
Wood Carolyn
Bought by
Buchanan Deborah
Purchase Details
Closed on
Feb 17, 1992
Sold by
Wood Jack M
Bought by
Wood Carolyn
Purchase Details
Closed on
Oct 31, 1991
Bought by
Wood Jack M
Create a Home Valuation Report for This Property
The Home Valuation Report is an in-depth analysis detailing your home's value as well as a comparison with similar homes in the area
Purchase History
| Date | Buyer | Sale Price | Title Company |
|---|---|---|---|
| Beauchamp Peggy Jo | $15,000 | -- | |
| Nationstar Mortgage Llc | $52,700 | -- | |
| Nationstar Mortgage Llc | $18,000 | -- | |
| Nipper Timothy A | $18,000 | -- | |
| Nipper Timothy A | $7,600 | -- | |
| Buchanan Deborah | $13,600 | -- | |
| Wood Carolyn | -- | -- | |
| Wood Jack M | $13,000 | -- |
Source: Public Records
Tax History
| Year | Tax Paid | Tax Assessment Tax Assessment Total Assessment is a certain percentage of the fair market value that is determined by local assessors to be the total taxable value of land and additions on the property. | Land | Improvement |
|---|---|---|---|---|
| 2025 | $1,698 | $61,206 | $1,200 | $60,006 |
| 2024 | $1,579 | $55,599 | $1,200 | $54,399 |
| 2023 | $1,540 | $52,796 | $1,200 | $51,596 |
| 2022 | $904 | $49,992 | $1,200 | $48,792 |
| 2021 | $886 | $47,189 | $1,200 | $45,989 |
| 2020 | $881 | $47,189 | $1,200 | $45,989 |
| 2019 | $887 | $47,189 | $1,200 | $45,989 |
| 2018 | $593 | $20,120 | $800 | $19,320 |
| 2017 | $817 | $20,120 | $800 | $19,320 |
| 2016 | $595 | $20,120 | $800 | $19,320 |
| 2015 | -- | $20,120 | $800 | $19,320 |
| 2014 | -- | $20,120 | $800 | $19,320 |
| 2013 | -- | $20,119 | $800 | $19,319 |
Source: Public Records
Map
Nearby Homes
Your Personal Tour Guide
Ask me questions while you tour the home.