205 17th St Grottoes, VA 24441
Estimated Value: $265,000 - $334,000
3
Beds
2
Baths
1,406
Sq Ft
$213/Sq Ft
Est. Value
About This Home
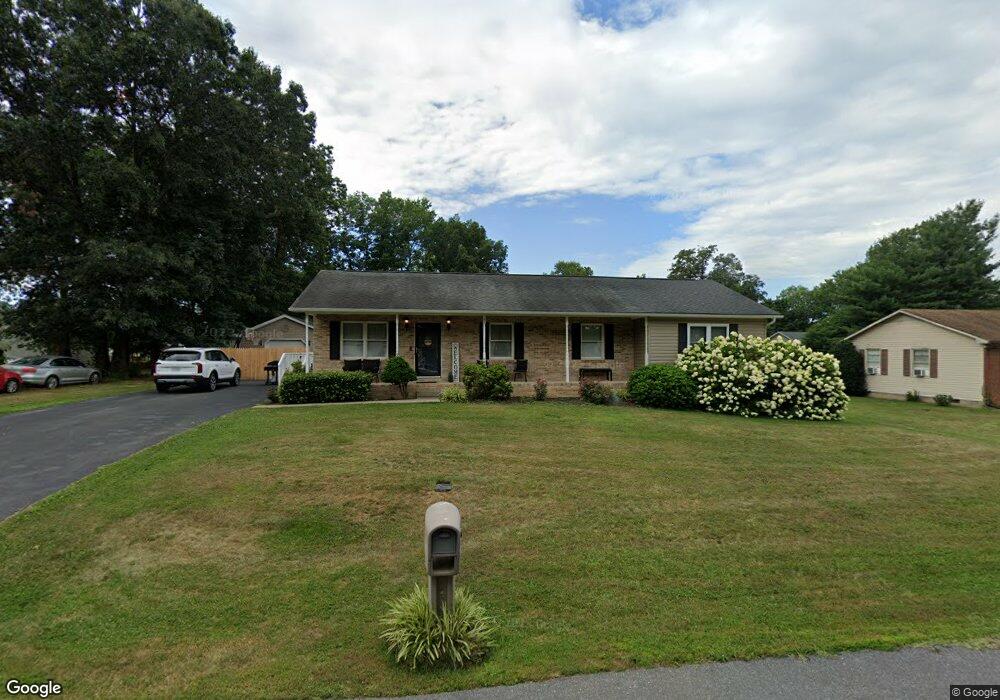
This home is located at 205 17th St, Grottoes, VA 24441 and is currently estimated at $299,073, approximately $212 per square foot. 205 17th St is a home located in Rockingham County with nearby schools including South River Elementary School, Montevideo Middle School, and Spotswood High School.
Ownership History
Date
Name
Owned For
Owner Type
Purchase Details
Closed on
Aug 12, 2019
Sold by
Kw & Dr Properties Llc
Bought by
May Investment Properties Llc
Current Estimated Value
Create a Home Valuation Report for This Property
The Home Valuation Report is an in-depth analysis detailing your home's value as well as a comparison with similar homes in the area
Home Values in the Area
Average Home Value in this Area
Purchase History
We collect this data history from publicly available records. To have your information removed, we recommend requesting removal directly through your county’s website.
| Date | Buyer | Sale Price | Title Company |
|---|---|---|---|
| May Investment Properties Llc | -- | None Available |
Source: Public Records
Tax History
| Year | Tax Paid | Tax Assessment Tax Assessment Total Assessment is a certain percentage of the fair market value that is determined by local assessors to be the total taxable value of land and additions on the property. | Land | Improvement |
|---|---|---|---|---|
| 2025 | $1,338 | $196,800 | $8,000 | $188,800 |
| 2024 | $1,338 | $196,800 | $8,000 | $188,800 |
| 2023 | $1,338 | $196,800 | $8,000 | $188,800 |
| 2022 | $1,338 | $196,800 | $8,000 | $188,800 |
| 2021 | $958 | $129,500 | $8,000 | $121,500 |
| 2020 | $958 | $129,500 | $8,000 | $121,500 |
| 2019 | $958 | $129,500 | $8,000 | $121,500 |
| 2018 | $958 | $129,500 | $8,000 | $121,500 |
| 2017 | $918 | $124,000 | $8,000 | $116,000 |
| 2016 | $868 | $124,000 | $8,000 | $116,000 |
| 2015 | $831 | $124,000 | $8,000 | $116,000 |
| 2014 | $618 | $124,000 | $8,000 | $116,000 |
Source: Public Records
Map
Nearby Homes
- 302 16th St
- 97 Laurel Oak Ln
- 605 13th St
- 809 Carson Cir
- 1428 Mandolin Ave
- 1430 Mandolin Ave
- 207 8th St
- 106 7th St
- 203 6th St
- 1112 Scruggs Ln
- Lots 4 & 5 Riverside Ave
- Lots 1 & 2 Riverside Ave
- 608 5th St
- 901 Riverside Ave
- TBD Black Rock Rd
- TBD E Side Hwy
- 0 E Side Hwy Unit 676320
- 0 E Side Hwy Unit VAAG2002800
- 7669 Fife Ln
- 000 Richland Ln
Your Personal Tour Guide
Ask me questions while you tour the home.