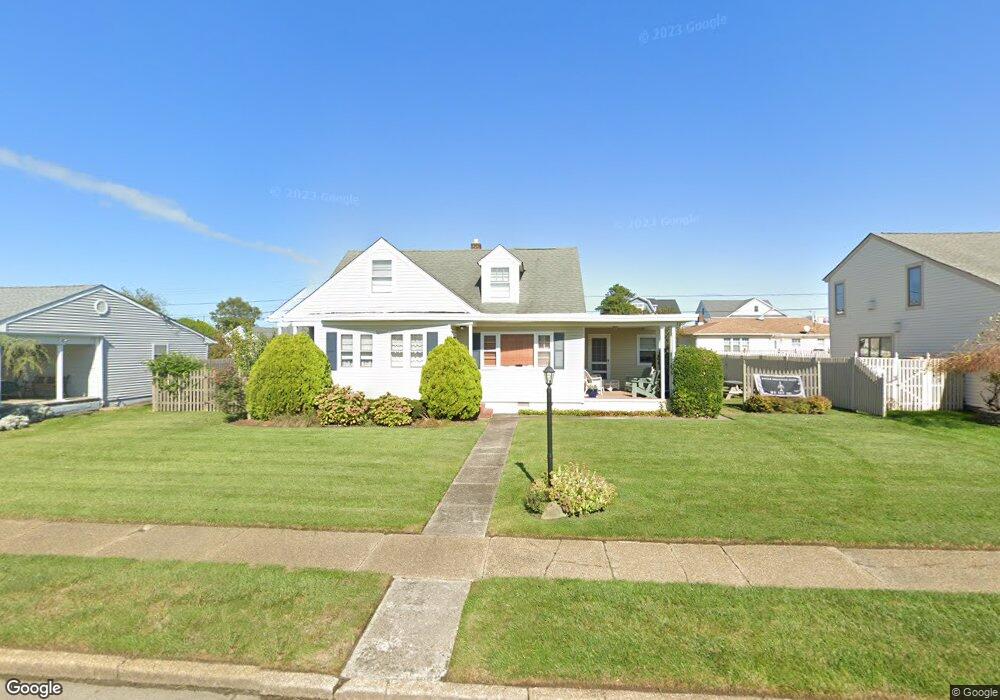
205 21st St S Brigantine, NJ 08203
Estimated Value: $776,000 - $1,040,000
--
Bed
--
Bath
1,673
Sq Ft
$549/Sq Ft
Est. Value
About This Home
This home is located at 205 21st St S, Brigantine, NJ 08203 and is currently estimated at $919,090, approximately $549 per square foot. 205 21st St S is a home located in Atlantic County with nearby schools including Brigantine Community School, Brigantine Elementary School, and New Hope Christian Academy/Robinson Small Learning Center.
Ownership History
Date
Name
Owned For
Owner Type
Purchase Details
Closed on
Dec 23, 2003
Sold by
21 South Llc
Bought by
Delorenzo Joseph M and Delorenzo Lauren W
Current Estimated Value
Home Financials for this Owner
Home Financials are based on the most recent Mortgage that was taken out on this home.
Original Mortgage
$175,000
Outstanding Balance
$81,827
Interest Rate
6.01%
Mortgage Type
Stand Alone Second
Estimated Equity
$837,263
Purchase Details
Closed on
Jul 25, 2001
Sold by
Goldstein Vickie
Bought by
21 South Llc
Home Financials for this Owner
Home Financials are based on the most recent Mortgage that was taken out on this home.
Original Mortgage
$180,000
Interest Rate
6.99%
Purchase Details
Closed on
Dec 5, 1990
Sold by
Tomasco Victoria
Bought by
Tomasco Victoria and Tomasco Vanhouten,Irvin
Purchase Details
Closed on
Apr 9, 1990
Sold by
Vanhouten Irvin and Vanhouten Kolke,Grace
Bought by
Tomasco Victoia
Create a Home Valuation Report for This Property
The Home Valuation Report is an in-depth analysis detailing your home's value as well as a comparison with similar homes in the area
Home Values in the Area
Average Home Value in this Area
Purchase History
| Date | Buyer | Sale Price | Title Company |
|---|---|---|---|
| Delorenzo Joseph M | -- | Infinity Title | |
| 21 South Llc | $225,000 | -- | |
| Tomasco Victoria | -- | -- | |
| Tomasco Victoia | -- | -- |
Source: Public Records
Mortgage History
| Date | Status | Borrower | Loan Amount |
|---|---|---|---|
| Open | Delorenzo Joseph M | $175,000 | |
| Previous Owner | 21 South Llc | $180,000 |
Source: Public Records
Tax History Compared to Growth
Tax History
| Year | Tax Paid | Tax Assessment Tax Assessment Total Assessment is a certain percentage of the fair market value that is determined by local assessors to be the total taxable value of land and additions on the property. | Land | Improvement |
|---|---|---|---|---|
| 2025 | $7,379 | $392,500 | $292,400 | $100,100 |
| 2024 | $7,379 | $392,500 | $292,400 | $100,100 |
| 2023 | $6,818 | $392,500 | $292,400 | $100,100 |
| 2022 | $6,818 | $392,500 | $292,400 | $100,100 |
| 2021 | $6,696 | $392,500 | $292,400 | $100,100 |
| 2020 | $6,625 | $392,500 | $292,400 | $100,100 |
| 2019 | $6,684 | $392,500 | $292,400 | $100,100 |
| 2018 | $6,818 | $392,500 | $292,400 | $100,100 |
| 2017 | $6,928 | $392,500 | $292,400 | $100,100 |
| 2016 | $6,924 | $392,500 | $292,400 | $100,100 |
| 2015 | $6,959 | $392,500 | $292,400 | $100,100 |
| 2014 | $6,700 | $392,500 | $292,400 | $100,100 |
Source: Public Records
Map
Nearby Homes
- 201 23rd St S
- 209 20th St S
- 1904 W Brigantine Ave
- 301 20th St S
- 106 24th St S
- 2502 Ocean Ave
- 102 28th St S
- 2905 Revere Blvd
- 1306 Bayshore Ave
- 312 13th St S
- 3007 Bayshore Ave Unit 4
- 405 30th St S
- 312 31st St S
- 250 11th St S
- 1000 W Brigantine Ave Unit 4
- 3300 W Brigantine Ave Unit 9
- 900 W Brigantine Ave
- 150 9th St S
- 222 8th St S
- 800 W Brigantine Ave Unit 217
- 201 21st St S
- 211 21st St S
- 204 20th St S
- 208 20th St S
- 200 20th St S
- 204 21st St S
- 215 21st St S
- 2006 Revere Blvd
- 2004 Revere Blvd
- 200 21st St S
- 208 21st St S
- 212 20th St S
- 2000 Revere Blvd
- 212 21st St S
- 2100 Revere Blvd
- 207 20th St S
- 2005 W Brigantine Ave
- 2001 W Brigantine Ave
- 203 22nd St S
- 201 22nd St S