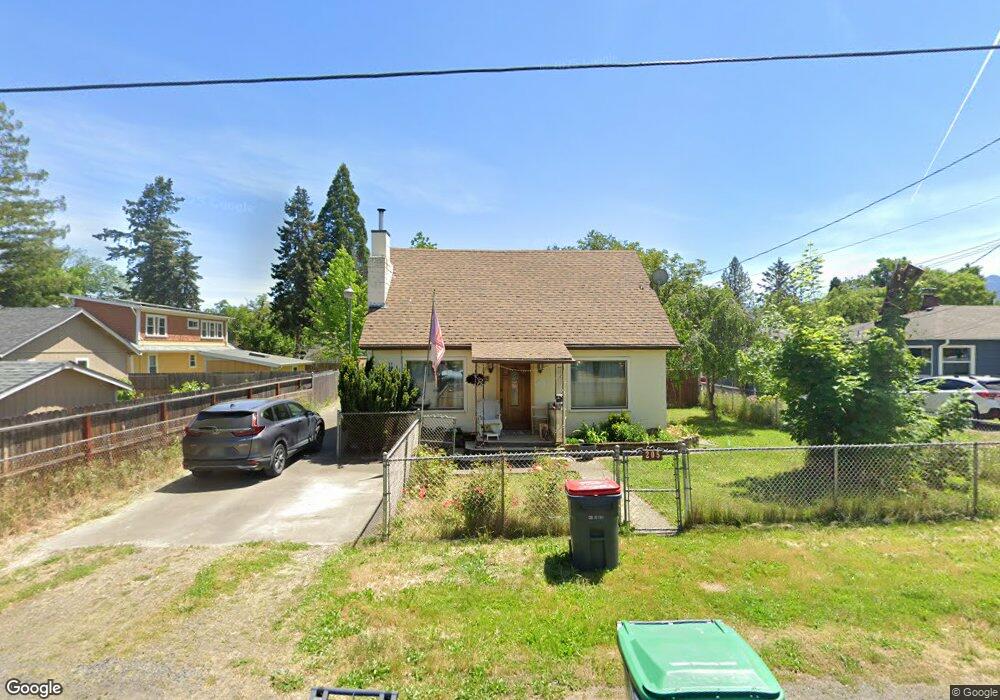
205 5th St Phoenix, OR 97535
Estimated Value: $289,531 - $377,000
1
Bed
1
Bath
1,392
Sq Ft
$236/Sq Ft
Est. Value
About This Home
This home is located at 205 5th St, Phoenix, OR 97535 and is currently estimated at $328,133, approximately $235 per square foot. 205 5th St is a home located in Jackson County with nearby schools including Phoenix Elementary School, Talent Middle School, and Phoenix High School.
Ownership History
Date
Name
Owned For
Owner Type
Purchase Details
Closed on
Apr 14, 2021
Sold by
Lawton John Kevin and Johnston Garry A
Bought by
Carpenter Brian
Current Estimated Value
Home Financials for this Owner
Home Financials are based on the most recent Mortgage that was taken out on this home.
Original Mortgage
$225,625
Outstanding Balance
$202,383
Interest Rate
3%
Mortgage Type
New Conventional
Estimated Equity
$125,750
Purchase Details
Closed on
Sep 1, 2005
Sold by
Johnston Dale E and Johnston Garry A
Bought by
Johnston Garry A and Johnston Dale E
Create a Home Valuation Report for This Property
The Home Valuation Report is an in-depth analysis detailing your home's value as well as a comparison with similar homes in the area
Home Values in the Area
Average Home Value in this Area
Purchase History
| Date | Buyer | Sale Price | Title Company |
|---|---|---|---|
| Carpenter Brian | $237,500 | First American Title | |
| Johnston Garry A | -- | Lawyers Title |
Source: Public Records
Mortgage History
| Date | Status | Borrower | Loan Amount |
|---|---|---|---|
| Open | Carpenter Brian | $225,625 |
Source: Public Records
Tax History
| Year | Tax Paid | Tax Assessment Tax Assessment Total Assessment is a certain percentage of the fair market value that is determined by local assessors to be the total taxable value of land and additions on the property. | Land | Improvement |
|---|---|---|---|---|
| 2026 | $2,555 | $160,210 | -- | -- |
| 2025 | $2,934 | $155,550 | $62,640 | $92,910 |
| 2024 | $2,934 | $151,020 | $60,820 | $90,200 |
| 2023 | $2,834 | $146,630 | $59,060 | $87,570 |
| 2022 | $2,847 | $146,630 | $59,060 | $87,570 |
| 2021 | $2,296 | $142,360 | $57,340 | $85,020 |
| 2020 | $2,224 | $138,220 | $55,670 | $82,550 |
| 2019 | $2,165 | $130,300 | $52,480 | $77,820 |
| 2018 | $2,101 | $126,510 | $50,950 | $75,560 |
| 2017 | $1,985 | $126,510 | $50,950 | $75,560 |
| 2016 | $1,932 | $119,260 | $48,030 | $71,230 |
| 2015 | $1,856 | $119,260 | $48,030 | $71,230 |
| 2014 | $1,786 | $112,420 | $45,270 | $67,150 |
Source: Public Records
Map
Nearby Homes
- 301 N Church St
- 316 W 3rd St
- 510 N Main St
- 600 N Main St
- 610 N Main St Unit 5A
- 612 N Main St
- 105 W 1st St
- 111 E 1st St
- 201 S Rose St
- 130 Sharon Dr
- 3459 S Pacific Hwy
- 921 N Rose St Unit A
- 300 Luman Rd Unit 200
- 401 Elm St
- 4074 S Pacific Hwy Unit 10
- 4069 S Pacific Hwy Unit 108
- 4069 S Pacific Hwy Unit 42
- 4069 S Pacific Hwy Unit 103
- 268 Oak Crest Way
- 817 Amerman Dr
Your Personal Tour Guide
Ask me questions while you tour the home.