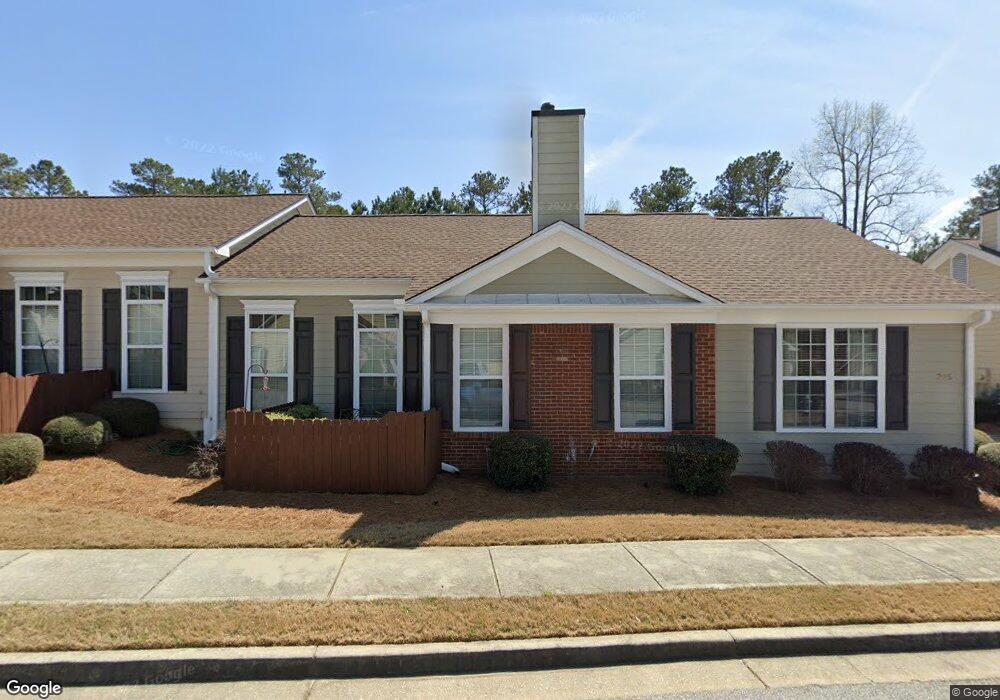
205 Accord Ln Grayson, GA 30017
Estimated Value: $272,000 - $296,000
2
Beds
2
Baths
1,452
Sq Ft
$193/Sq Ft
Est. Value
About This Home
This home is located at 205 Accord Ln, Grayson, GA 30017 and is currently estimated at $280,899, approximately $193 per square foot. 205 Accord Ln is a home located in Gwinnett County with nearby schools including Grayson Elementary School, Bay Creek Middle School, and Grayson High School.
Ownership History
Date
Name
Owned For
Owner Type
Purchase Details
Closed on
Aug 30, 2018
Sold by
Drake Philip M
Bought by
Clark Jane M
Current Estimated Value
Home Financials for this Owner
Home Financials are based on the most recent Mortgage that was taken out on this home.
Original Mortgage
$40,000
Outstanding Balance
$34,743
Interest Rate
4.6%
Mortgage Type
New Conventional
Estimated Equity
$246,156
Purchase Details
Closed on
Jan 21, 2005
Sold by
Villas Of Pebble Creek Farm Sales
Bought by
Clark Jane M
Home Financials for this Owner
Home Financials are based on the most recent Mortgage that was taken out on this home.
Original Mortgage
$17,900
Interest Rate
5.62%
Mortgage Type
New Conventional
Purchase Details
Closed on
Jun 16, 2004
Sold by
The Villas Of Pebble Creek Farm Llc
Bought by
Villas Of Pebble Creek Farm Sales
Home Financials for this Owner
Home Financials are based on the most recent Mortgage that was taken out on this home.
Original Mortgage
$909,900
Interest Rate
6.3%
Create a Home Valuation Report for This Property
The Home Valuation Report is an in-depth analysis detailing your home's value as well as a comparison with similar homes in the area
Home Values in the Area
Average Home Value in this Area
Purchase History
| Date | Buyer | Sale Price | Title Company |
|---|---|---|---|
| Clark Jane M | -- | -- | |
| Clark Jane M | -- | -- | |
| Clark Jane M | $159,900 | -- | |
| Villas Of Pebble Creek Farm Sales | $346,400 | -- |
Source: Public Records
Mortgage History
| Date | Status | Borrower | Loan Amount |
|---|---|---|---|
| Open | Clark Jane M | $40,000 | |
| Closed | Clark Jane M | $40,000 | |
| Previous Owner | Clark Jane M | $17,900 | |
| Previous Owner | Clark Jane M | $127,920 | |
| Previous Owner | Villas Of Pebble Creek Farm Sales | $909,900 |
Source: Public Records
Tax History
| Year | Tax Paid | Tax Assessment Tax Assessment Total Assessment is a certain percentage of the fair market value that is determined by local assessors to be the total taxable value of land and additions on the property. | Land | Improvement |
|---|---|---|---|---|
| 2025 | $1,082 | $123,960 | $20,000 | $103,960 |
| 2024 | $1,083 | $114,920 | $20,000 | $94,920 |
| 2023 | $1,083 | $115,880 | $15,400 | $100,480 |
| 2022 | $1,044 | $97,160 | $12,800 | $84,360 |
| 2021 | $764 | $74,800 | $10,400 | $64,400 |
| 2020 | $1,209 | $74,800 | $10,400 | $64,400 |
| 2019 | $1,058 | $70,360 | $10,400 | $59,960 |
| 2018 | $901 | $59,920 | $12,000 | $47,920 |
| 2016 | $819 | $50,720 | $8,000 | $42,720 |
| 2015 | $799 | $47,920 | $8,000 | $39,920 |
| 2014 | $762 | $44,840 | $8,000 | $36,840 |
Source: Public Records
Map
Nearby Homes
- 112 Camry Ln
- 124 Camry Ln
- 314 Gable Brook Dr SW
- 1205 Mistyhaynes Way
- 1207 Mistyhaynes Way
- 422 Copeland St
- 2700 Haynescrest Dr
- 2687 Pointcrest Way
- 2880 Cooper Brook Dr
- 889 Bramble Way
- 0 Athens Hwy Unit 7653669
- 623 Hawthorn Ln
- 2984 Gayle Manor Ln
- 1028 Bramble Way
- 2994 Brooks Dr
- 2935 Haynes Club Cir Unit 2
- 2979 Overwood Ln
- 1255 Summit Point Ln
- 1135 Pebble Bend Dr
- 1080 Pebble Bend Dr
- 201 Accord Ln
- 209 Accord Ln
- 209 Accord Ln Ln
- 207 Accord Ln
- 207 Accord Ln Unit 207
- 203 Accord Ln
- 203 Accord Ln Unit 203
- 213 Accord Ln
- 204 Accord Ln
- 302 Gable Brook Dr
- 211 Accord Ln
- 301 Gable Brook Dr
- 202 Accord Ln
- 304 Gable Brook Dr
- 215 Accord Ln
- 303 Gable Brook Dr
- 316 Gable Brook Dr SW
- 306 Gable Brook Dr
- 308 Gable Brook Dr Unit 308
- 308 Gable Brook Dr
Your Personal Tour Guide
Ask me questions while you tour the home.