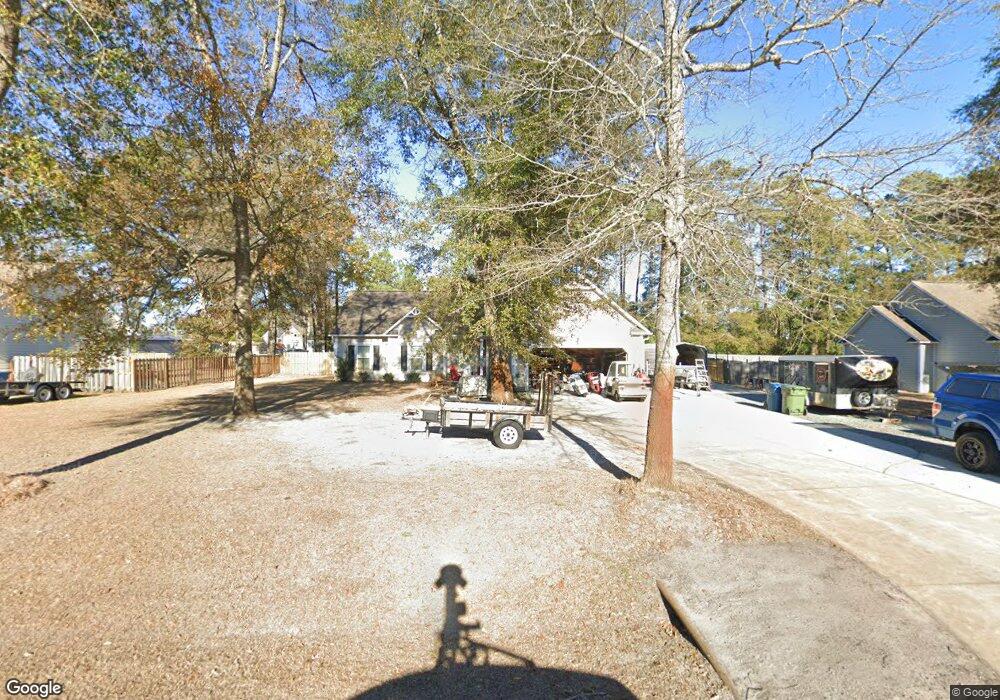
205 Anchor Ln Sneads Ferry, NC 28460
Estimated Value: $195,000 - $354,000
4
Beds
2
Baths
1,637
Sq Ft
$186/Sq Ft
Est. Value
About This Home
This home is located at 205 Anchor Ln, Sneads Ferry, NC 28460 and is currently estimated at $304,034, approximately $185 per square foot. 205 Anchor Ln is a home located in Onslow County with nearby schools including Dixon Elementary School, Dixon High School, and Born Again Christian Academy.
Ownership History
Date
Name
Owned For
Owner Type
Purchase Details
Closed on
Oct 12, 2013
Sold by
Owings Donald L and Owings Donna C
Bought by
Pedigo Jimmy D and Pedigo Belinda Kay
Current Estimated Value
Home Financials for this Owner
Home Financials are based on the most recent Mortgage that was taken out on this home.
Original Mortgage
$177,747
Outstanding Balance
$47,088
Interest Rate
4.58%
Mortgage Type
Purchase Money Mortgage
Estimated Equity
$256,946
Purchase Details
Closed on
Aug 11, 2010
Sold by
Nationwide Investments Inc
Bought by
Owings Donald L and Owings Donna C
Home Financials for this Owner
Home Financials are based on the most recent Mortgage that was taken out on this home.
Original Mortgage
$151,950
Interest Rate
4.61%
Mortgage Type
New Conventional
Purchase Details
Closed on
Jan 13, 2010
Sold by
Hanratty Deborah K and Estate Of Lee C Biggar
Bought by
Nationwide Investments Inc
Create a Home Valuation Report for This Property
The Home Valuation Report is an in-depth analysis detailing your home's value as well as a comparison with similar homes in the area
Home Values in the Area
Average Home Value in this Area
Purchase History
| Date | Buyer | Sale Price | Title Company |
|---|---|---|---|
| Pedigo Jimmy D | $225,000 | None Available | |
| Owings Donald L | $190,000 | None Available | |
| Nationwide Investments Inc | $100,000 | None Available | |
| Nationwide Investments Inc | $100,000 | None Available |
Source: Public Records
Mortgage History
| Date | Status | Borrower | Loan Amount |
|---|---|---|---|
| Open | Pedigo Jimmy D | $177,747 | |
| Previous Owner | Owings Donald L | $151,950 |
Source: Public Records
Tax History Compared to Growth
Tax History
| Year | Tax Paid | Tax Assessment Tax Assessment Total Assessment is a certain percentage of the fair market value that is determined by local assessors to be the total taxable value of land and additions on the property. | Land | Improvement |
|---|---|---|---|---|
| 2025 | $1,689 | $187,667 | $0 | $187,667 |
| 2024 | $1,689 | $257,873 | $50,000 | $207,873 |
| 2023 | $1,689 | $257,873 | $50,000 | $207,873 |
| 2022 | $1,689 | $257,873 | $50,000 | $207,873 |
| 2021 | $1,263 | $179,080 | $40,000 | $139,080 |
| 2020 | $1,263 | $179,080 | $40,000 | $139,080 |
| 2019 | $1,263 | $179,080 | $40,000 | $139,080 |
| 2018 | $1,263 | $179,080 | $40,000 | $139,080 |
| 2017 | $1,280 | $189,570 | $50,000 | $139,570 |
| 2016 | $1,280 | $189,570 | $0 | $0 |
| 2015 | $1,280 | $189,570 | $0 | $0 |
| 2014 | $1,280 | $189,570 | $0 | $0 |
Source: Public Records
Map
Nearby Homes
- 1015 Meridian Dr
- 104 Affirmed Place
- 410 Celtic Ash St
- 120 Secretariat Dr
- 108 Ennett Ln
- 239 Shellbank Dr
- 310 Celtic Ash St
- 328 Windmill Light Way
- 361 Chadwick Shores Dr
- 353 Chadwick Shores Dr
- Lot S2 Riva Ridge Rd
- 136 Cedar Hollow Ln
- 212 Everett Dr
- Vienna 1788 Plan at Windpointe - The Cliffs
- Vienna B Plan at Windpointe - The Shores
- Vienna A Plan at Windpointe - The Shores
- Laura 3307 Plan at Windpointe - The Cliffs
- Layne w/ Bonus Plan at Windpointe - The Shores
- Palomar Plan at Windpointe - The Shores
- Jade Plan at Windpointe - The Cliffs