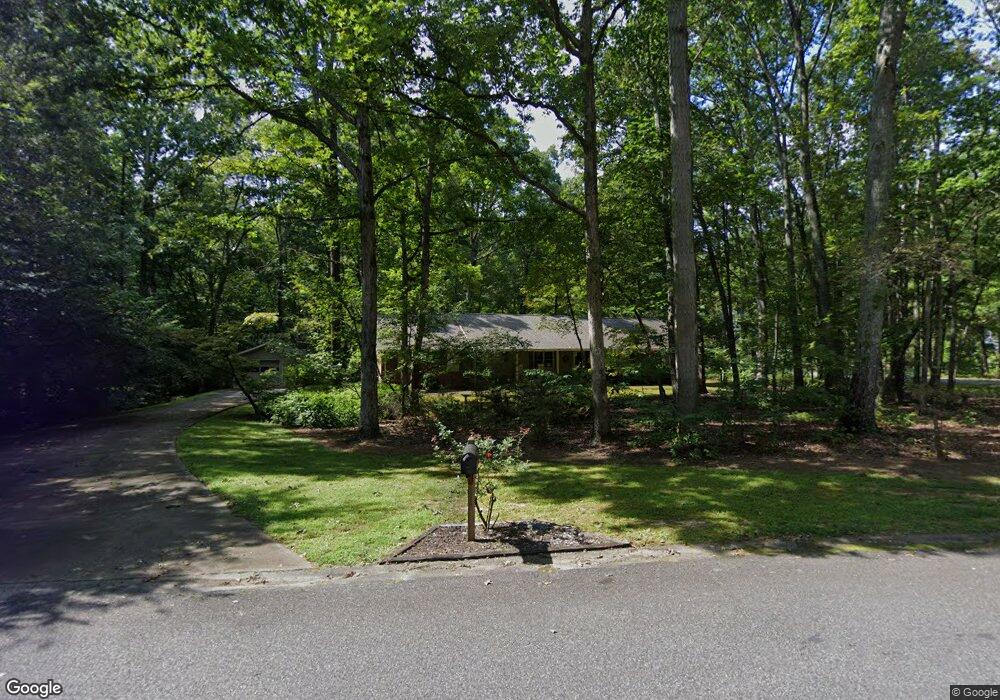
205 Andover Dr Alpharetta, GA 30009
Estimated Value: $732,000 - $872,497
4
Beds
3
Baths
2,176
Sq Ft
$378/Sq Ft
Est. Value
About This Home
This home is located at 205 Andover Dr, Alpharetta, GA 30009 and is currently estimated at $822,874, approximately $378 per square foot. 205 Andover Dr is a home located in Fulton County with nearby schools including Alpharetta Elementary School, Hopewell Middle School, and Cambridge High School.
Ownership History
Date
Name
Owned For
Owner Type
Purchase Details
Closed on
May 31, 2024
Sold by
Catherine Brantley Savage Revocable Livi
Bought by
Catherine Brantley Savage Revocable Livi and Savage Catherine Brantley Trust
Current Estimated Value
Purchase Details
Closed on
Sep 21, 2010
Sold by
Savage Clark B
Bought by
Savage Catherine B
Home Financials for this Owner
Home Financials are based on the most recent Mortgage that was taken out on this home.
Original Mortgage
$136,000
Interest Rate
4.45%
Mortgage Type
New Conventional
Purchase Details
Closed on
Apr 27, 2000
Sold by
Phillips Virginia A
Bought by
Savage Clark B and Savage Catherine B
Home Financials for this Owner
Home Financials are based on the most recent Mortgage that was taken out on this home.
Original Mortgage
$183,600
Interest Rate
8.28%
Mortgage Type
New Conventional
Create a Home Valuation Report for This Property
The Home Valuation Report is an in-depth analysis detailing your home's value as well as a comparison with similar homes in the area
Home Values in the Area
Average Home Value in this Area
Purchase History
| Date | Buyer | Sale Price | Title Company |
|---|---|---|---|
| Catherine Brantley Savage Revocable Livi | -- | -- | |
| Savage Catherine B | -- | -- | |
| Savage Clark B | $214,000 | -- |
Source: Public Records
Mortgage History
| Date | Status | Borrower | Loan Amount |
|---|---|---|---|
| Previous Owner | Savage Catherine B | $136,000 | |
| Previous Owner | Savage Clark B | $183,600 |
Source: Public Records
Tax History Compared to Growth
Tax History
| Year | Tax Paid | Tax Assessment Tax Assessment Total Assessment is a certain percentage of the fair market value that is determined by local assessors to be the total taxable value of land and additions on the property. | Land | Improvement |
|---|---|---|---|---|
| 2025 | $1,653 | $277,400 | $82,320 | $195,080 |
| 2023 | $1,653 | $287,560 | $94,800 | $192,760 |
| 2022 | $4,828 | $224,920 | $57,960 | $166,960 |
| 2021 | $5,695 | $204,800 | $44,520 | $160,280 |
| 2020 | $4,019 | $189,040 | $52,200 | $136,840 |
| 2019 | $657 | $195,080 | $30,760 | $164,320 |
| 2018 | $3,223 | $190,520 | $30,040 | $160,480 |
| 2017 | $3,315 | $133,080 | $35,120 | $97,960 |
| 2016 | $3,297 | $133,080 | $35,120 | $97,960 |
| 2015 | $3,875 | $133,080 | $35,120 | $97,960 |
| 2014 | $2,287 | $87,360 | $23,040 | $64,320 |
Source: Public Records
Map
Nearby Homes
- 4016 Dover Ave
- 326 Andover Dr
- 141 North Trace
- 3988 Dover Ave Unit 1
- 115 Baxley Ln
- 150 Cobblestone Way
- 5610 Surrey Ct
- 295 Pebble Trail
- 406 Woodliff Place
- 925 Pebblestone Ct
- 320 Shady Grove Ln
- 1845 Evergreen Ln
- 1880 Mayfield Rd
- 2632 Vintage Dr Unit 9
- 2644 Vintage Dr
- 4110 Providence Square
- 150 Shady Grove Ln
- 193 Jere Dr
- 191 North Trace
- 220 North Trace
- 180 Andover Dr
- 181 North Trace
- 240 Oakmere Dr
- 235 Oakmere Dr Unit 2
- 195 Andover Dr
- 650 Brookford Dr
- 225 Oakmere Dr
- 245 Oakmere Dr
- 170 Andover Dr Unit 2
- 171 North Trace
- 210 North Trace
- 190 North Trace
- 190 North Trace
- 185 Andover Dr
- 640 Brookford Dr
- 255 Oakmere Dr
- 4021 Dover Ave
- 200 North Trace