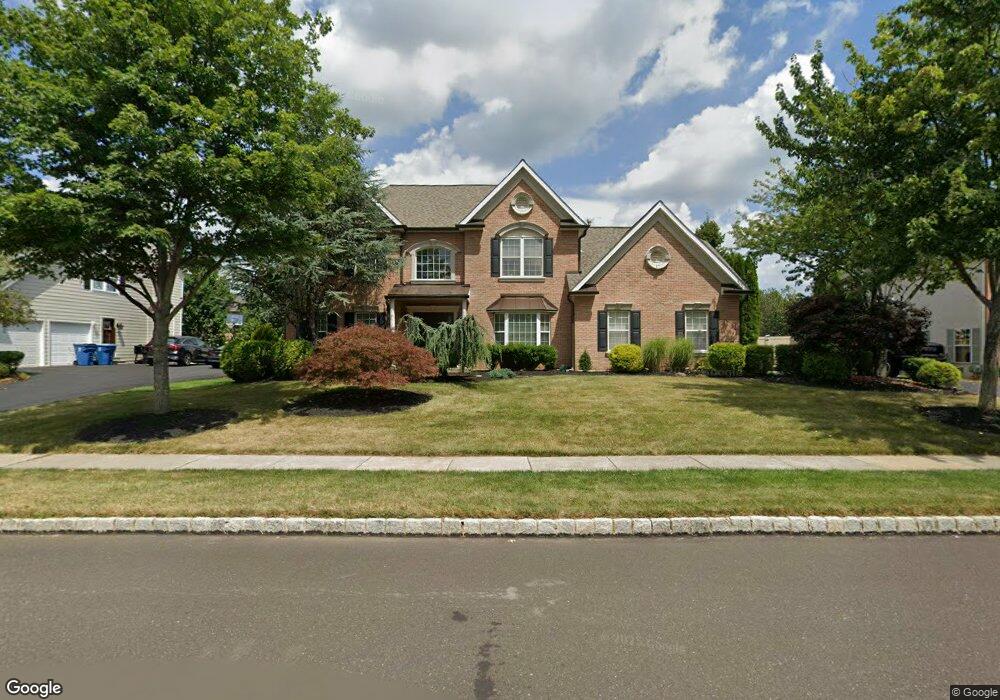
205 Avondale Dr North Wales, PA 19454
Estimated Value: $896,000 - $1,071,000
4
Beds
3
Baths
4,293
Sq Ft
$231/Sq Ft
Est. Value
About This Home
This home is located at 205 Avondale Dr, North Wales, PA 19454 and is currently estimated at $990,888, approximately $230 per square foot. 205 Avondale Dr is a home located in Montgomery County with nearby schools including Montgomery Elementary School, Pennbrook Middle School, and North Penn Senior High School.
Ownership History
Date
Name
Owned For
Owner Type
Purchase Details
Closed on
Apr 18, 2005
Sold by
Cutler Group Inc
Bought by
Cipero Francis N and Cipero Karen L
Current Estimated Value
Home Financials for this Owner
Home Financials are based on the most recent Mortgage that was taken out on this home.
Original Mortgage
$51,900
Outstanding Balance
$26,939
Interest Rate
5.87%
Mortgage Type
Credit Line Revolving
Estimated Equity
$963,949
Purchase Details
Closed on
Apr 6, 2005
Sold by
Cutler Group Inc
Bought by
Cipero Francis N and Cipero Karen L
Home Financials for this Owner
Home Financials are based on the most recent Mortgage that was taken out on this home.
Original Mortgage
$51,900
Outstanding Balance
$26,939
Interest Rate
5.87%
Mortgage Type
Credit Line Revolving
Estimated Equity
$963,949
Create a Home Valuation Report for This Property
The Home Valuation Report is an in-depth analysis detailing your home's value as well as a comparison with similar homes in the area
Home Values in the Area
Average Home Value in this Area
Purchase History
| Date | Buyer | Sale Price | Title Company |
|---|---|---|---|
| Cipero Francis N | $519,314 | -- | |
| Cipero Francis N | $519,314 | -- |
Source: Public Records
Mortgage History
| Date | Status | Borrower | Loan Amount |
|---|---|---|---|
| Open | Cipero Francis N | $51,900 | |
| Open | Cipero Francis N | $415,450 | |
| Closed | Cipero Francis N | $51,900 | |
| Closed | Cipero Francis N | $415,450 |
Source: Public Records
Tax History Compared to Growth
Tax History
| Year | Tax Paid | Tax Assessment Tax Assessment Total Assessment is a certain percentage of the fair market value that is determined by local assessors to be the total taxable value of land and additions on the property. | Land | Improvement |
|---|---|---|---|---|
| 2025 | $12,432 | $333,240 | -- | -- |
| 2024 | $12,432 | $333,240 | -- | -- |
| 2023 | $11,860 | $333,240 | $0 | $0 |
| 2022 | $10,654 | $310,240 | $76,610 | $233,630 |
| 2021 | $10,016 | $310,240 | $76,610 | $233,630 |
| 2020 | $9,752 | $310,240 | $76,610 | $233,630 |
| 2019 | $9,570 | $310,240 | $76,610 | $233,630 |
| 2018 | $1,652 | $310,240 | $76,610 | $233,630 |
| 2017 | $9,161 | $310,240 | $76,610 | $233,630 |
| 2016 | $9,039 | $310,240 | $76,610 | $233,630 |
| 2015 | $8,632 | $310,240 | $76,610 | $233,630 |
| 2014 | $8,632 | $310,240 | $76,610 | $233,630 |
Source: Public Records
Map
Nearby Homes
- 964 Knapp Rd
- 3103 Hemmingway Dr
- 3406 Elizabeths Ct
- 220 Hampton Green Dr
- 115 Castle Dr
- 1506 Naomis Ct
- 1101 Barbaras Ct
- 502 Williamsburg Rd
- 102 Gwynmont Dr
- 117 Gwynmont Dr
- 825 Monticello Place
- 873 Lombardy Dr
- 407 Anthony Ct
- 203 Jonathan Dr
- 106 Jene Ct
- 1114 W Thomas Rd
- 1204 Vilsmeier Rd
- 105 Higher Rock Ct
- 100 Higher Rock Ct
- 501 Joshua Ct