Estimated Value: $260,000 - $328,000
4
Beds
3
Baths
2,000
Sq Ft
$148/Sq Ft
Est. Value
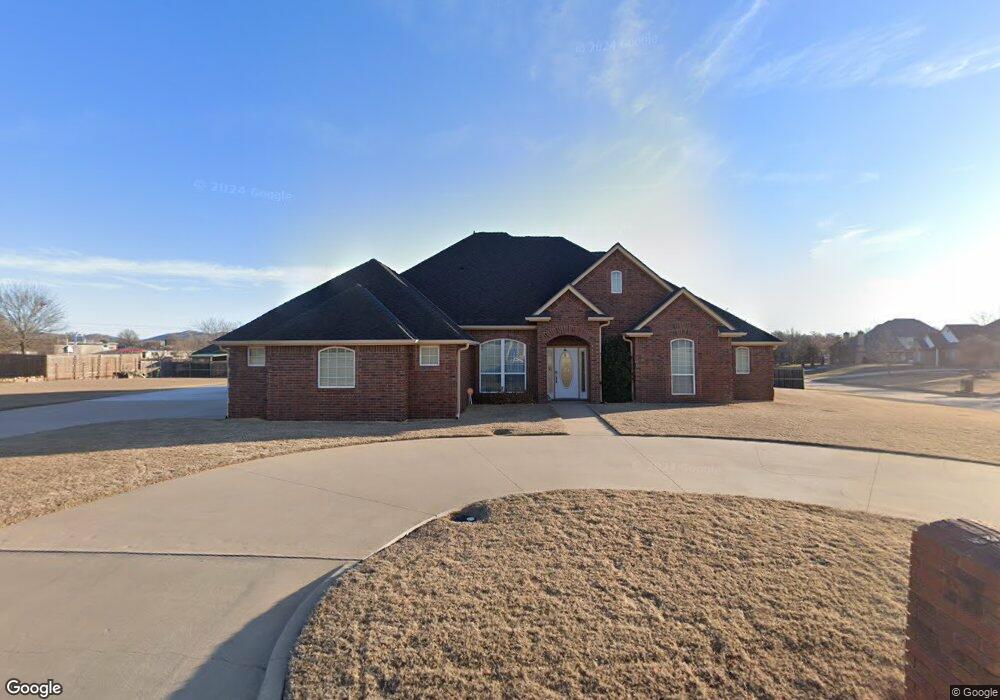
About This Home
This home is located at 205 Begonia Ln, Cache, OK 73527 and is currently estimated at $296,633, approximately $148 per square foot. 205 Begonia Ln is a home located in Comanche County with nearby schools including Cache Primary Elementary School, Cache Intermediate Elementary School, and Cache Middle School.
Ownership History
Date
Name
Owned For
Owner Type
Purchase Details
Closed on
Dec 5, 2018
Sold by
Drake Richard A and Steinhans Drake Susan K
Bought by
Drake Richard Allan and Ste Susan
Current Estimated Value
Purchase Details
Closed on
Dec 4, 2018
Sold by
Secretary Of Veterans Affairs
Bought by
Drake Richard A and Steinhaus Drake Susan K
Purchase Details
Closed on
Aug 7, 2018
Sold by
Freedom Mortgage Corp
Bought by
Secretary Of Veterans Affairs
Purchase Details
Closed on
Mar 21, 2018
Sold by
Richardson Paris J
Bought by
Freedom Mortgage Cor
Purchase Details
Closed on
Jan 30, 2008
Sold by
Leveron Dr Bud and Leveron Bud
Bought by
Ricahrdson Paris Joseph
Home Financials for this Owner
Home Financials are based on the most recent Mortgage that was taken out on this home.
Original Mortgage
$244,649
Interest Rate
6.15%
Mortgage Type
VA
Purchase Details
Closed on
Aug 5, 2004
Sold by
Huddleston Stonewall J
Create a Home Valuation Report for This Property
The Home Valuation Report is an in-depth analysis detailing your home's value as well as a comparison with similar homes in the area
Home Values in the Area
Average Home Value in this Area
Purchase History
| Date | Buyer | Sale Price | Title Company |
|---|---|---|---|
| Drake Richard Allan | -- | Title & Closingi | |
| Drake Richard A | $203,000 | Title & Closing | |
| Secretary Of Veterans Affairs | -- | None Available | |
| Freedom Mortgage Cor | -- | None Available | |
| Ricahrdson Paris Joseph | $239,500 | -- | |
| -- | $450,000 | -- |
Source: Public Records
Mortgage History
| Date | Status | Borrower | Loan Amount |
|---|---|---|---|
| Previous Owner | Ricahrdson Paris Joseph | $244,649 |
Source: Public Records
Tax History
| Year | Tax Paid | Tax Assessment Tax Assessment Total Assessment is a certain percentage of the fair market value that is determined by local assessors to be the total taxable value of land and additions on the property. | Land | Improvement |
|---|---|---|---|---|
| 2025 | $3,008 | $29,281 | $5,625 | $23,656 |
| 2024 | $2,959 | $28,428 | $5,625 | $22,803 |
| 2023 | $2,959 | $27,715 | $3,375 | $24,340 |
| 2022 | $2,953 | $27,241 | $3,375 | $23,866 |
| 2021 | $2,372 | $26,448 | $3,375 | $23,073 |
| 2020 | $2,502 | $25,677 | $3,375 | $22,302 |
| 2019 | $2,517 | $25,677 | $3,375 | $22,302 |
| 2018 | $2,700 | $26,168 | $3,375 | $22,793 |
| 2017 | $2,762 | $27,657 | $3,251 | $24,406 |
| 2016 | $2,586 | $26,340 | $2,531 | $23,809 |
| 2015 | $2,580 | $26,340 | $2,531 | $23,809 |
| 2014 | $2,545 | $26,340 | $2,531 | $23,809 |
Source: Public Records
Map
Nearby Homes
- 817 Hummingbird Dr
- 207 & 1/2 N Crater Creek Rd
- 206 W C Ave
- 209 E B Ave
- 207 C Ave
- 703 SW 6th
- 405 N Mountain Meadow Dr
- 111 S 6th St
- 112 NW Elm Ave
- 108 NW Elm Ave
- 815 W D Ave
- 17168 W Gore Blvd
- 414 NW Granite Ave
- 433 NE Creekside Dr
- 206 Pine Ave
- 627 NW Granite Ave
- 214 NW Sandstone Ave
- 168 SW Crater Creek Rd
- 406 Shady Ln
- 303 Woodland Cir
- 304 Azalea Ln
- 203 Begonia Ln
- 1001 Hummingbird Dr
- 302 Azalea Ln
- 824 Hummingbird Dr
- 206 Begonia Ln
- 822 Hummingbird Dr
- 201 Begonia Ln
- 204 Begonia Ln
- 303 Azalea Ln
- 301 Azalea Ln
- 820 Hummingbird Dr
- 202 Begonia Ln
- 1003 Hummingbird Dr
- 840 Hummingbird Dr
- 818 Hummingbird Dr
- 818 Hummingbird Dr
- 818 Hummingbird Dr
- 818 Hummingbird Dr
- 818 Hummingbird Dr
Your Personal Tour Guide
Ask me questions while you tour the home.