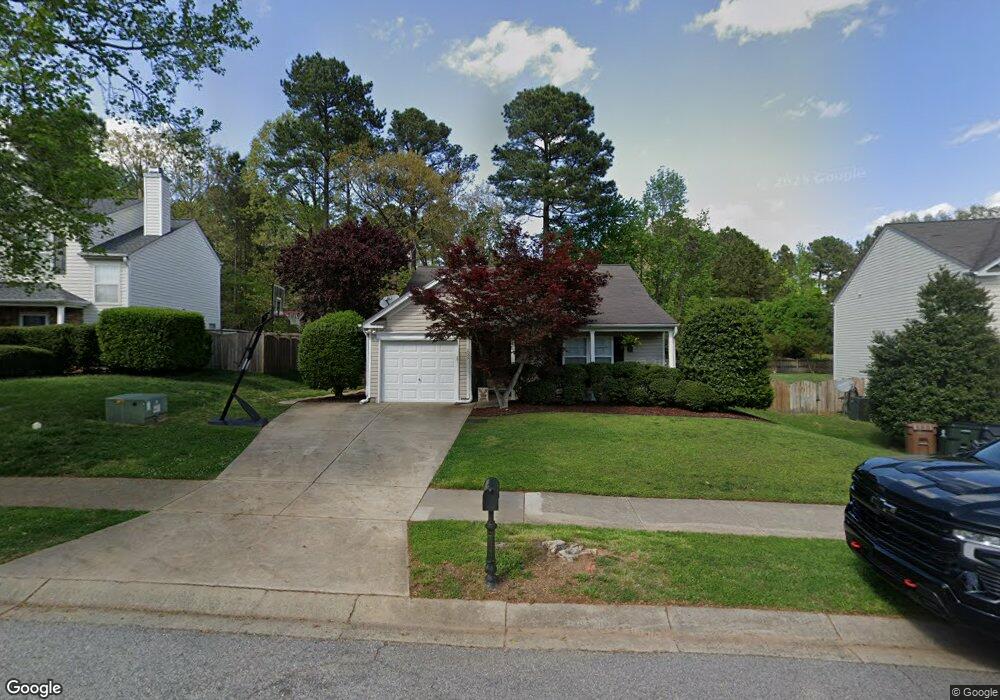
205 Beverstone Dr Holly Springs, NC 27540
Estimated Value: $368,000 - $381,596
3
Beds
2
Baths
1,459
Sq Ft
$256/Sq Ft
Est. Value
About This Home
This home is located at 205 Beverstone Dr, Holly Springs, NC 27540 and is currently estimated at $374,149, approximately $256 per square foot. 205 Beverstone Dr is a home located in Wake County with nearby schools including Oakview Elementary School, Apex Friendship Middle School, and Holly Springs High School.
Ownership History
Date
Name
Owned For
Owner Type
Purchase Details
Closed on
Sep 26, 2012
Sold by
Lake Matthew P and Lake Andria M
Bought by
Miller Edward P and Miller Susan A
Current Estimated Value
Home Financials for this Owner
Home Financials are based on the most recent Mortgage that was taken out on this home.
Original Mortgage
$116,000
Outstanding Balance
$80,967
Interest Rate
3.68%
Mortgage Type
New Conventional
Estimated Equity
$293,182
Purchase Details
Closed on
Sep 22, 2003
Sold by
Lake Matthew P and Lake Andria M
Bought by
Lake Matthew P and Lake Andria M
Home Financials for this Owner
Home Financials are based on the most recent Mortgage that was taken out on this home.
Original Mortgage
$30,500
Interest Rate
5.28%
Mortgage Type
Stand Alone Second
Create a Home Valuation Report for This Property
The Home Valuation Report is an in-depth analysis detailing your home's value as well as a comparison with similar homes in the area
Home Values in the Area
Average Home Value in this Area
Purchase History
| Date | Buyer | Sale Price | Title Company |
|---|---|---|---|
| Miller Edward P | $145,000 | None Available | |
| Lake Matthew P | -- | -- |
Source: Public Records
Mortgage History
| Date | Status | Borrower | Loan Amount |
|---|---|---|---|
| Open | Miller Edward P | $116,000 | |
| Previous Owner | Lake Matthew P | $30,500 |
Source: Public Records
Tax History Compared to Growth
Tax History
| Year | Tax Paid | Tax Assessment Tax Assessment Total Assessment is a certain percentage of the fair market value that is determined by local assessors to be the total taxable value of land and additions on the property. | Land | Improvement |
|---|---|---|---|---|
| 2025 | $3,119 | $360,060 | $120,000 | $240,060 |
| 2024 | $3,106 | $360,060 | $120,000 | $240,060 |
| 2023 | $2,596 | $238,812 | $65,000 | $173,812 |
| 2022 | $2,506 | $238,812 | $65,000 | $173,812 |
| 2021 | $2,460 | $238,812 | $65,000 | $173,812 |
| 2020 | $2,460 | $238,812 | $65,000 | $173,812 |
| 2019 | $2,298 | $189,362 | $55,000 | $134,362 |
| 2018 | $2,078 | $189,362 | $55,000 | $134,362 |
| 2017 | $2,004 | $189,362 | $55,000 | $134,362 |
| 2016 | $1,976 | $189,362 | $55,000 | $134,362 |
| 2015 | $1,850 | $174,355 | $45,000 | $129,355 |
| 2014 | $1,786 | $174,355 | $45,000 | $129,355 |
Source: Public Records
Map
Nearby Homes
- 224 Hartshorn Ct
- 126 Tuska Hills Dr
- 104 Chilmark Ridge Dr
- 321 Cross Hill Ln
- 105 Cross Hill Ln
- 225 Douglas St
- 405 W Ballentine St
- 124 Cliffdale Rd
- 112 Burt St
- 737 W Holly Springs Rd
- 743 W Holly Springs Rd
- 749 W Holly Springs Rd
- 755 W Holly Springs Rd
- 761 W Holly Springs Rd
- 108 Crabwall Ct
- 321 Blalock St
- 220 Avent Ferry Rd
- 318 Blalock St
- 1205 Trotter Bluffs Dr
- 100 Sire Ct
- 201 Beverstone Dr
- 209 Beverstone Dr
- 109 Beverstone Dr
- 100 Tiverton Woods Dr
- 137 Clay Ridge Way
- 200 Beverstone Dr
- 104 Tiverton Woods Dr
- 105 Beverstone Dr
- 133 Clay Ridge Way
- 204 Beverstone Dr
- 108 Tiverton Woods Dr
- 129 Clay Ridge Way
- 104 Beverstone Dr
- 101 Beverstone Dr
- 300 Beverstone Dr
- 100 Saranac Ridge Dr
- 112 Tiverton Woods Dr
- 125 Clay Ridge Way
- 105 Walehurst Ridge Dr
- 100 Beverstone Dr