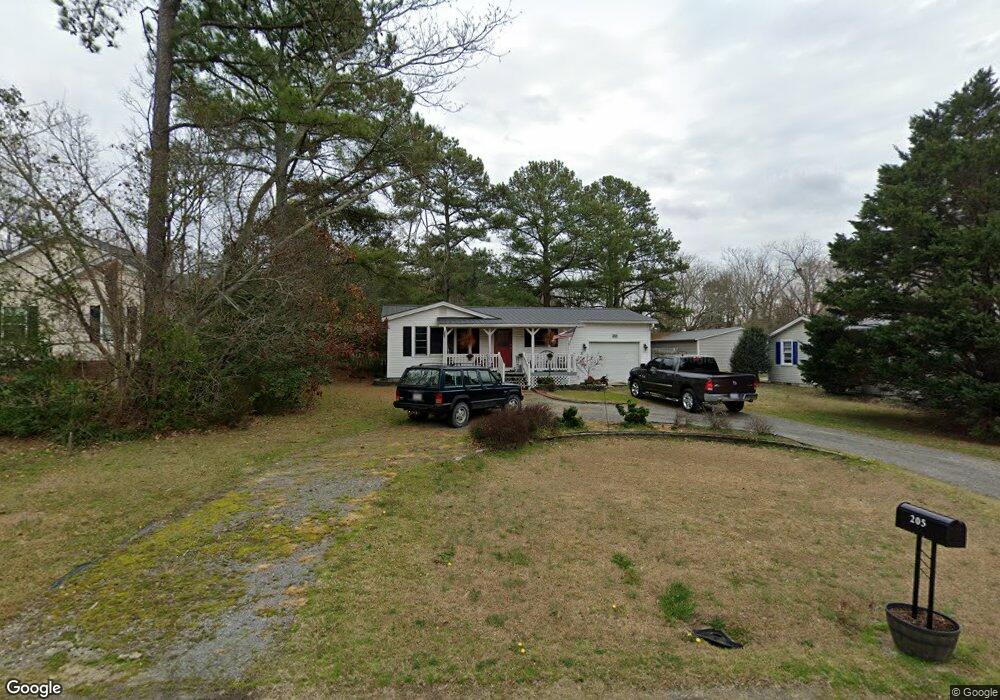
205 Bingham St Carthage, NC 28327
Estimated Value: $137,000 - $174,000
1
Bed
1
Bath
616
Sq Ft
$243/Sq Ft
Est. Value
About This Home
This home is located at 205 Bingham St, Carthage, NC 28327 and is currently estimated at $149,486, approximately $242 per square foot. 205 Bingham St is a home located in Moore County with nearby schools including Carthage Elementary School, New Century Middle School, and Union Pines High School.
Ownership History
Date
Name
Owned For
Owner Type
Purchase Details
Closed on
Apr 14, 2020
Sold by
Simpson Richard and Simpson Wesley
Bought by
Wainwright John
Current Estimated Value
Home Financials for this Owner
Home Financials are based on the most recent Mortgage that was taken out on this home.
Original Mortgage
$85,832
Outstanding Balance
$75,892
Interest Rate
3.3%
Mortgage Type
New Conventional
Estimated Equity
$73,594
Purchase Details
Closed on
Dec 29, 2017
Sold by
Hill Ricky Chad and Hill Amanda Yarbrough
Bought by
Simpson Richard and Simpson Polly
Home Financials for this Owner
Home Financials are based on the most recent Mortgage that was taken out on this home.
Original Mortgage
$60,000
Interest Rate
3.92%
Mortgage Type
New Conventional
Purchase Details
Closed on
Apr 12, 2007
Sold by
Yarter Robert and Yarter Lena Marie
Bought by
Hill Ricky Chad and Yarbrough Amanda
Home Financials for this Owner
Home Financials are based on the most recent Mortgage that was taken out on this home.
Original Mortgage
$69,000
Interest Rate
6.25%
Mortgage Type
Unknown
Purchase Details
Closed on
May 22, 2003
Sold by
Yarter Robert and Lena Mari
Bought by
Hill Ricky Chad and Yarbrough Amanda
Create a Home Valuation Report for This Property
The Home Valuation Report is an in-depth analysis detailing your home's value as well as a comparison with similar homes in the area
Home Values in the Area
Average Home Value in this Area
Purchase History
| Date | Buyer | Sale Price | Title Company |
|---|---|---|---|
| Wainwright John | $82,500 | None Available | |
| Simpson Richard | $75,000 | None Available | |
| Hill Ricky Chad | $68,000 | None Available | |
| Hill Ricky Chad | -- | -- |
Source: Public Records
Mortgage History
| Date | Status | Borrower | Loan Amount |
|---|---|---|---|
| Open | Wainwright John | $85,832 | |
| Previous Owner | Simpson Richard | $60,000 | |
| Previous Owner | Hill Ricky Chad | $69,000 |
Source: Public Records
Tax History
| Year | Tax Paid | Tax Assessment Tax Assessment Total Assessment is a certain percentage of the fair market value that is determined by local assessors to be the total taxable value of land and additions on the property. | Land | Improvement |
|---|---|---|---|---|
| 2024 | $883 | $103,560 | $35,000 | $68,560 |
| 2023 | $904 | $103,560 | $35,000 | $68,560 |
| 2022 | $744 | $72,230 | $22,000 | $50,230 |
| 2021 | $762 | $72,230 | $22,000 | $50,230 |
| 2020 | $769 | $72,230 | $22,000 | $50,230 |
| 2019 | $769 | $72,230 | $22,000 | $50,230 |
| 2018 | $553 | $55,310 | $20,000 | $35,310 |
| 2017 | $548 | $55,310 | $20,000 | $35,310 |
| 2015 | $542 | $55,310 | $20,000 | $35,310 |
| 2014 | $501 | $54,720 | $20,000 | $34,720 |
| 2013 | -- | $54,720 | $20,000 | $34,720 |
Source: Public Records
Map
Nearby Homes
- 207 Bingham St
- 801 Monroe St
- 00 Isley St
- 917 Ocean Ct
- TBD Currie St
- 806 Currie St
- 234 Eaton St
- 168 Carver St
- 143 Carver St
- Grenoble Plan at Carriage Hills
- Hamel Plan at Carriage Hills
- Janville Plan at Carriage Hills
- Lyon Plan at Carriage Hills
- 154 Carver St
- 137 Carver St
- 148 Carver St
- 131 Carver St
- 142 Carver St
- 203 Bingham St
- 209 Bingham St
- 208 Bingham St
- 702 Saunders St
- 208 Vass Carthage Rd
- 301 Bingham St
- 704 Saunders St
- 608 E Saunders St
- 606 Saunders St
- 701 Vick St
- 211 Vass Carthage Rd
- 306 Bingham St
- 236 Vass Carthage Rd
- 113 Vass Carthage Rd
- 0 Vick St
- 111 Vass Carthage Rd
- 605 Saunders St
- 108 Bingham St
- 704 Vick St
- 250 Vass Carthage Rd
Your Personal Tour Guide
Ask me questions while you tour the home.