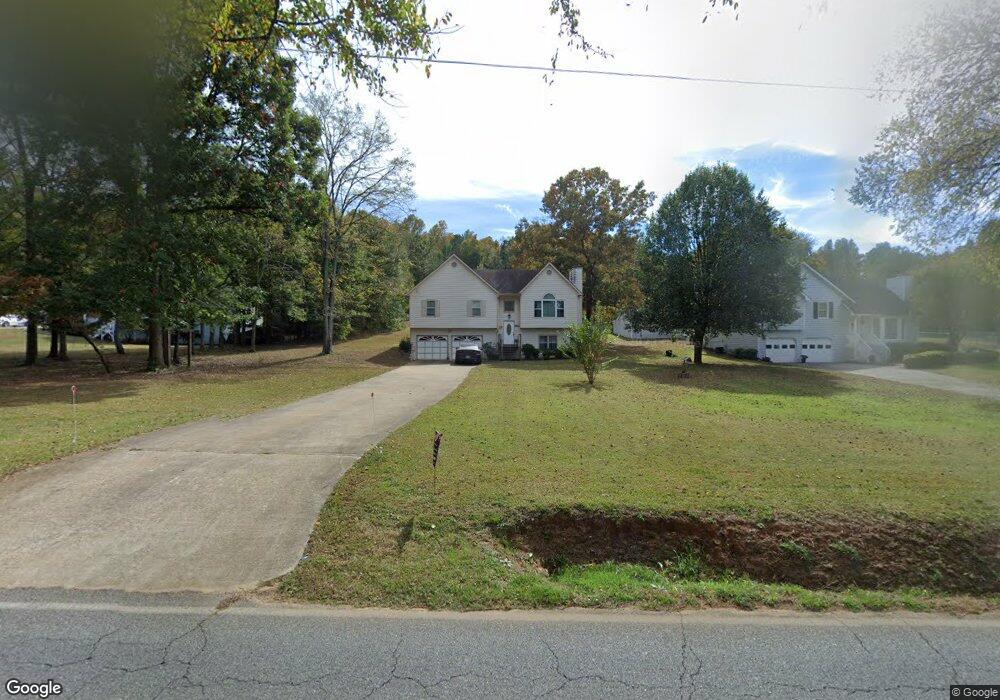
205 Bishop Rd NW Cartersville, GA 30121
Estimated Value: $257,000 - $324,000
3
Beds
3
Baths
1,668
Sq Ft
$179/Sq Ft
Est. Value
About This Home
This home is located at 205 Bishop Rd NW, Cartersville, GA 30121 and is currently estimated at $298,826, approximately $179 per square foot. 205 Bishop Rd NW is a home located in Bartow County with nearby schools including Kingston Elementary School, Cass Middle School, and Cass High School.
Ownership History
Date
Name
Owned For
Owner Type
Purchase Details
Closed on
May 31, 2013
Sold by
Tapley George A
Bought by
Tapley Mark S
Current Estimated Value
Home Financials for this Owner
Home Financials are based on the most recent Mortgage that was taken out on this home.
Original Mortgage
$88,000
Outstanding Balance
$19,624
Interest Rate
3.37%
Mortgage Type
New Conventional
Estimated Equity
$279,202
Purchase Details
Closed on
Jun 17, 2008
Sold by
Lasalle Bank National Asso
Bought by
Tapley George W and Tapley Martha B
Purchase Details
Closed on
Apr 1, 2008
Sold by
Carbajo Peter R
Bought by
Lasalle Bank National Associat
Purchase Details
Closed on
Oct 26, 2006
Sold by
Inglese Maureen A
Bought by
Carbajo Peter R
Home Financials for this Owner
Home Financials are based on the most recent Mortgage that was taken out on this home.
Original Mortgage
$143,968
Interest Rate
6.27%
Mortgage Type
New Conventional
Purchase Details
Closed on
Mar 14, 2005
Sold by
Inglese Anthony F
Bought by
Inglese Maureen
Create a Home Valuation Report for This Property
The Home Valuation Report is an in-depth analysis detailing your home's value as well as a comparison with similar homes in the area
Home Values in the Area
Average Home Value in this Area
Purchase History
| Date | Buyer | Sale Price | Title Company |
|---|---|---|---|
| Tapley Mark S | $110,000 | -- | |
| Tapley George W | $107,900 | -- | |
| Lasalle Bank National Associat | $121,151 | -- | |
| Carbajo Peter R | $143,968 | -- | |
| Inglese Maureen | -- | -- |
Source: Public Records
Mortgage History
| Date | Status | Borrower | Loan Amount |
|---|---|---|---|
| Open | Tapley Mark S | $88,000 | |
| Previous Owner | Carbajo Peter R | $143,968 |
Source: Public Records
Tax History Compared to Growth
Tax History
| Year | Tax Paid | Tax Assessment Tax Assessment Total Assessment is a certain percentage of the fair market value that is determined by local assessors to be the total taxable value of land and additions on the property. | Land | Improvement |
|---|---|---|---|---|
| 2024 | $2,391 | $104,820 | $24,000 | $80,820 |
| 2023 | $2,391 | $100,351 | $22,600 | $77,751 |
| 2022 | $1,997 | $85,228 | $18,000 | $67,228 |
| 2021 | $1,495 | $62,647 | $18,000 | $44,647 |
| 2020 | $1,529 | $60,647 | $16,000 | $44,647 |
| 2019 | $1,256 | $50,240 | $12,000 | $38,240 |
| 2018 | $1,260 | $50,240 | $12,000 | $38,240 |
| 2017 | $1,267 | $50,240 | $12,000 | $38,240 |
| 2016 | $1,276 | $50,240 | $12,000 | $38,240 |
| 2015 | $1,335 | $52,240 | $12,000 | $40,240 |
| 2014 | $1,012 | $39,680 | $6,000 | $33,680 |
| 2013 | -- | $33,400 | $8,000 | $25,400 |
Source: Public Records
Map
Nearby Homes
- 70 Baker Rd SE
- 1771 Joe Frank Harris Pkwy SE
- 30 Amberidge Dr NW
- 46 Mac Johnson Rd NW
- 0 Mac Johnson Rd NW Unit 7616934
- 354 Oakridge Dr SE
- 109 Amberidge Dr NW
- 104 Amberidge Dr NW
- 383 Oakridge Dr SE
- 40 Bishop Mill Dr NW
- 261 Jordan Rd SE
- 11 Meadow View Cir
- 36 Live Oak Run NW
- 102 Burnt Hickory Tract 2 Rd
- 4 Shallowood Place
- 602 Grassdale Rd
- 0 Joe Frank Harris Pkwy SE Unit 7284313
- 217 Eva Way NE
- 207 Bishop Rd NW
- 203 Bishop Rd NW
- 209 Bishop Rd NW
- 197 Bishop Rd NW
- 37 Country Walk
- 11 Country Meadow Way NW
- 211 Bishop Rd NW
- 36 Country Walk
- 193 Bishop Rd NW
- 13 Country Meadow Way NW
- 35 Country Walk
- 35 Country Walk
- 15 Tillton Trail SE
- 13 Dawn Dr SE
- 19 W Ridge Dr SE
- 191 Bishop Rd NW
- 191 Bishop Rd NW
- 17 Brook Hollow Ln
- 11 Dawn Dr SE
- 15 Country Meadow Way NW