205 Byron Hurst St Lagrange, GA 30240
Estimated Value: $118,654
--
Bed
--
Bath
1,980
Sq Ft
$60/Sq Ft
Est. Value
About This Home
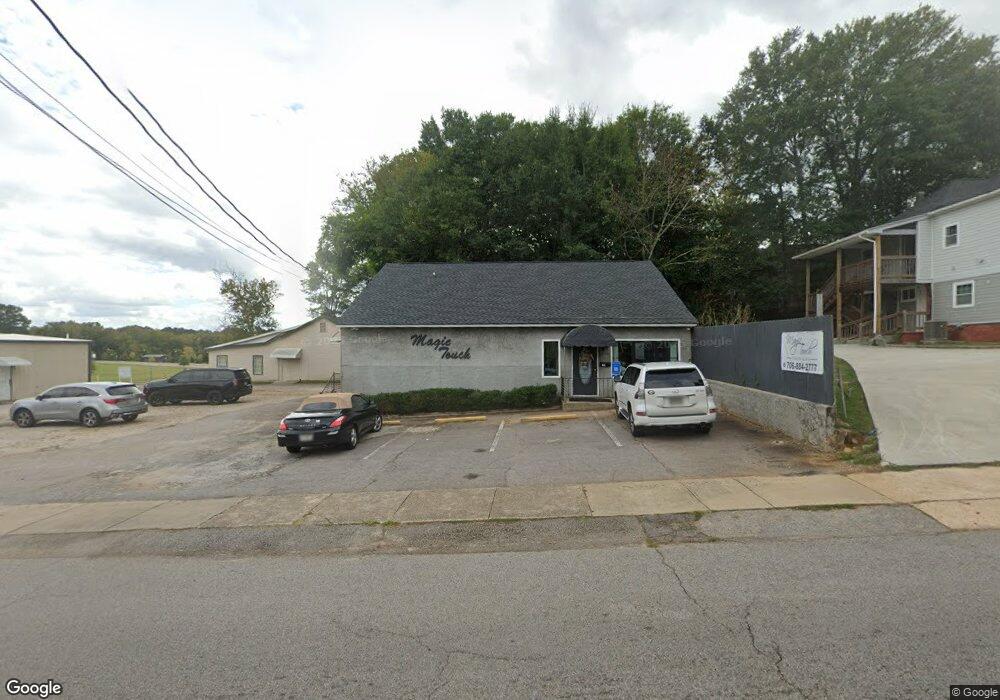
This home is located at 205 Byron Hurst St, Lagrange, GA 30240 and is currently estimated at $118,654, approximately $59 per square foot. 205 Byron Hurst St is a home located in Troup County with nearby schools including Hollis Hand Elementary School, Ethel W. Kight Elementary School, and Franklin Forest Elementary School.
Ownership History
Date
Name
Owned For
Owner Type
Purchase Details
Closed on
Aug 28, 2023
Sold by
Ayres Sarah Delaney
Bought by
Magic Touch Salon & Spa Llc
Current Estimated Value
Home Financials for this Owner
Home Financials are based on the most recent Mortgage that was taken out on this home.
Original Mortgage
$100,000
Outstanding Balance
$35,621
Interest Rate
6.81%
Mortgage Type
New Conventional
Estimated Equity
$83,033
Purchase Details
Closed on
Jan 27, 1984
Sold by
Thomas Alan Ayers
Bought by
Ayres Sarah Delaney
Purchase Details
Closed on
Apr 26, 1976
Sold by
Shepherd W M
Bought by
Thomas Alan Ayers
Purchase Details
Closed on
Nov 11, 1975
Sold by
Bartley J F
Bought by
Shepherd W M
Purchase Details
Closed on
Jun 26, 1956
Sold by
Bartley J W
Bought by
Bartley J F
Purchase Details
Closed on
Jan 1, 1953
Sold by
Daniel T A
Bought by
Bartley J W
Create a Home Valuation Report for This Property
The Home Valuation Report is an in-depth analysis detailing your home's value as well as a comparison with similar homes in the area
Home Values in the Area
Average Home Value in this Area
Purchase History
| Date | Buyer | Sale Price | Title Company |
|---|---|---|---|
| Magic Touch Salon & Spa Llc | $110,000 | -- | |
| Ayres Sarah Delaney | -- | -- | |
| Thomas Alan Ayers | $23,400 | -- | |
| Shepherd W M | -- | -- | |
| Bartley J F | -- | -- | |
| Bartley J W | -- | -- |
Source: Public Records
Mortgage History
| Date | Status | Borrower | Loan Amount |
|---|---|---|---|
| Open | Magic Touch Salon & Spa Llc | $100,000 |
Source: Public Records
Tax History Compared to Growth
Tax History
| Year | Tax Paid | Tax Assessment Tax Assessment Total Assessment is a certain percentage of the fair market value that is determined by local assessors to be the total taxable value of land and additions on the property. | Land | Improvement |
|---|---|---|---|---|
| 2024 | $1,200 | $44,400 | $10,000 | $34,400 |
| 2023 | $1,181 | $43,320 | $10,000 | $33,320 |
| 2022 | $1,209 | $43,320 | $10,000 | $33,320 |
| 2021 | $1,064 | $35,280 | $10,000 | $25,280 |
| 2020 | $1,064 | $35,280 | $10,000 | $25,280 |
| 2019 | $1,152 | $38,200 | $10,000 | $28,200 |
| 2018 | $1,147 | $38,028 | $10,352 | $27,676 |
| 2017 | $1,147 | $38,028 | $10,352 | $27,676 |
| 2016 | $1,147 | $38,028 | $10,352 | $27,676 |
| 2015 | $1,149 | $38,028 | $10,352 | $27,676 |
| 2014 | $1,151 | $38,028 | $10,352 | $27,676 |
| 2013 | -- | $38,028 | $10,352 | $27,676 |
Source: Public Records
Map
Nearby Homes
- 505 S Lewis St
- 509 S Lewis St
- 516 S Lewis St
- 141 Main St
- 206 Peachtree St
- 206 Broad St
- 209 Boulevard
- 207 Wilkes St
- 103 Boulevard
- 208 Boulevard
- 101 McGee St
- 500 Boulevard
- 203 Fannin St
- 303 E Mulberry St
- 205 Fannin St
- 513 Park Ave
- 501 Milam St
- W W Crovat St
- 410 Gordon St
- 910 N 916 1000 1002 N Oak & 1011 1019 1021 Johnson St
- 401 S Lewis St
- 401 S Lewis St Unit 4
- 401 S Lewis St Unit 2
- 401 S Lewis St Unit 1
- 401 S Lewis St Unit 3
- 403 S Lewis St
- 313 S Lewis St
- 405 S Lewis St
- S S Lewis St Unit C
- 0 S Lewis St Unit 7118392
- 0 S Lewis St Unit 8623402
- 0 S Lewis St Unit 8930991
- S S Lewis St Unit 6-7
- S S Lewis St
- 311 S Lewis St
- 407 S Lewis St
- 404 S Lewis St
- 409 S Lewis St
- 406 S Lewis St
- 312 S Lewis St