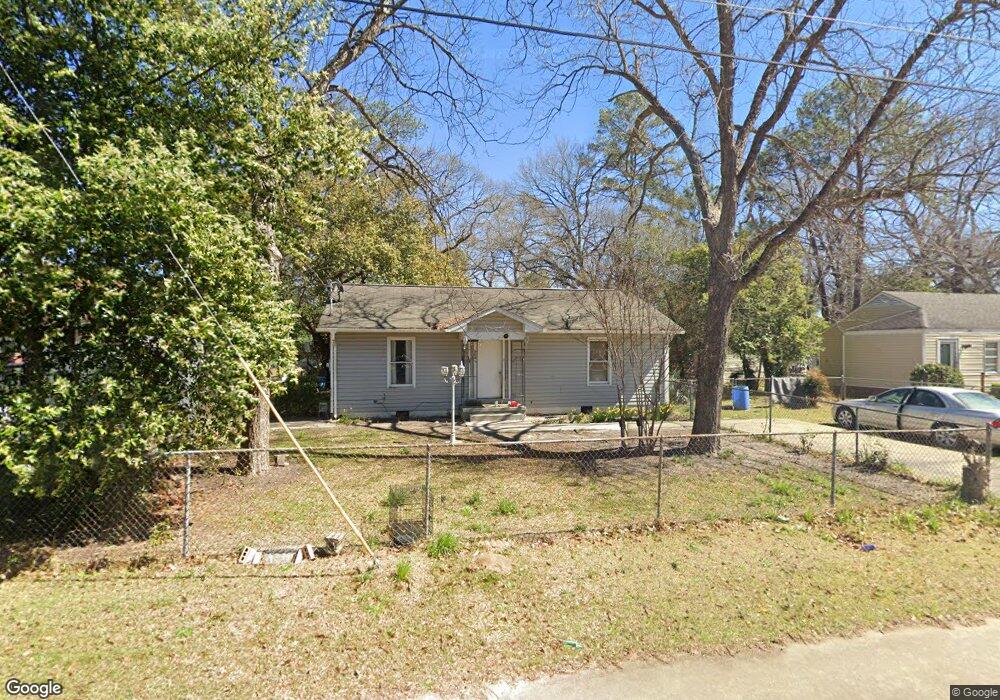
205 Camellia Cir Warner Robins, GA 31093
Estimated Value: $93,000 - $114,000
3
Beds
1
Bath
993
Sq Ft
$106/Sq Ft
Est. Value
About This Home
This home is located at 205 Camellia Cir, Warner Robins, GA 31093 and is currently estimated at $105,445, approximately $106 per square foot. 205 Camellia Cir is a home located in Houston County with nearby schools including Lindsey Elementary School, Westside Elementary School, and Northside Middle School.
Ownership History
Date
Name
Owned For
Owner Type
Purchase Details
Closed on
Apr 6, 2018
Sold by
Talton Alonzo
Bought by
Hargrove Pamela Denise
Current Estimated Value
Home Financials for this Owner
Home Financials are based on the most recent Mortgage that was taken out on this home.
Original Mortgage
$47,500
Outstanding Balance
$34,501
Interest Rate
4.4%
Mortgage Type
New Conventional
Estimated Equity
$70,944
Purchase Details
Closed on
Aug 12, 1985
Sold by
Cuebas Jose R
Bought by
Hakes Eldon D
Purchase Details
Closed on
Jan 17, 1980
Sold by
Cuebas Jose R and Cuebas Vicki D
Bought by
Cuebas Jose R
Purchase Details
Closed on
Oct 27, 1978
Sold by
Wells William N and Wells Sondria J
Bought by
Cuebas Jose R and Cuebas Vicki D
Purchase Details
Closed on
Nov 15, 1976
Sold by
Hakes Helen B
Bought by
Wells William N and Wells Sondria J
Purchase Details
Closed on
Sep 24, 1974
Sold by
Hakes Eldon D and Hakes Helen B
Bought by
Hakes Helen B
Purchase Details
Closed on
Jul 1, 1973
Sold by
Samples John Matthew and Ola Rut
Bought by
Hakes Eldon D and Hakes Helen B
Purchase Details
Closed on
Oct 28, 1966
Sold by
Fha
Bought by
Samples John Matthew and Ola Ruth
Create a Home Valuation Report for This Property
The Home Valuation Report is an in-depth analysis detailing your home's value as well as a comparison with similar homes in the area
Home Values in the Area
Average Home Value in this Area
Purchase History
| Date | Buyer | Sale Price | Title Company |
|---|---|---|---|
| Hargrove Pamela Denise | $100 | None Available | |
| Hakes Eldon D | -- | -- | |
| Cuebas Jose R | -- | -- | |
| Cuebas Jose R | -- | -- | |
| Wells William N | -- | -- | |
| Hakes Helen B | -- | -- | |
| Hakes Eldon D | -- | -- | |
| Samples John Matthew | -- | -- |
Source: Public Records
Mortgage History
| Date | Status | Borrower | Loan Amount |
|---|---|---|---|
| Open | Hargrove Pamela Denise | $47,500 |
Source: Public Records
Tax History Compared to Growth
Tax History
| Year | Tax Paid | Tax Assessment Tax Assessment Total Assessment is a certain percentage of the fair market value that is determined by local assessors to be the total taxable value of land and additions on the property. | Land | Improvement |
|---|---|---|---|---|
| 2024 | $1,039 | $31,760 | $5,000 | $26,760 |
| 2023 | $805 | $24,400 | $2,680 | $21,720 |
| 2022 | $508 | $22,080 | $2,680 | $19,400 |
| 2021 | $461 | $19,920 | $2,680 | $17,240 |
| 2020 | $460 | $19,800 | $2,680 | $17,120 |
| 2019 | $460 | $19,800 | $2,680 | $17,120 |
| 2018 | $460 | $19,800 | $2,680 | $17,120 |
| 2017 | $414 | $19,800 | $2,680 | $17,120 |
| 2016 | $415 | $19,800 | $2,680 | $17,120 |
| 2015 | -- | $19,800 | $2,680 | $17,120 |
| 2014 | -- | $19,800 | $2,680 | $17,120 |
| 2013 | -- | $19,800 | $2,680 | $17,120 |
Source: Public Records
Map
Nearby Homes
- 714 Camellia Cir
- 105 Angela Ave
- 303 Carroll Dr
- 102 Camellia Cir
- 239 Ward St
- 427 Alabama Ave
- 423 Alabama Ave
- 101 Jacobs Ln
- 212 Dunmurry Place
- 434 Carolina Ave
- 215 Camellia Cir
- 405 Ward St
- 302 Dunmurry Place
- 313 Johns Rd
- 316 Johns Rd
- 300 Ward St
- 720 N Davis Dr
- 100 Mauldon Ct
- 308 Camellia Cir
- 437 Dunmurry Place
- 205 Camellia Cir
- 205 Camellia Cir Unit 8
- 203 Wallace Dr
- 207 Wallace Dr
- 627 Camellia Cir
- 209 Wallace Dr
- 625 Camellia Cir
- 123 Wallace Dr
- 202 Wallace Dr
- 624 Camellia Cir
- 703 Camellia Cir
- 202 Sewell Cir
- 318 Evergreen St
- 315 Evergreen St
- 124 Wallace Dr
- 623 Camellia Cir
- 215 Wallace Dr
- 705 Camellia Cir
- 620 Camellia Cir
- 122 Wallace Dr