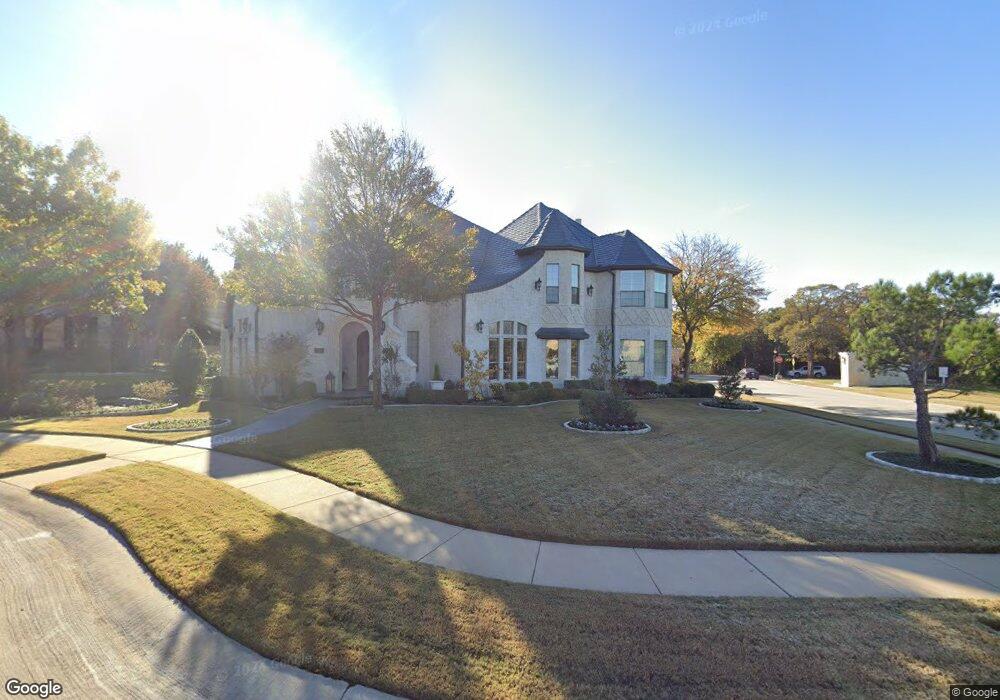
205 Capriole Ct Colleyville, TX 76034
Estimated Value: $1,148,000 - $1,282,000
4
Beds
5
Baths
4,543
Sq Ft
$267/Sq Ft
Est. Value
About This Home
This home is located at 205 Capriole Ct, Colleyville, TX 76034 and is currently estimated at $1,211,537, approximately $266 per square foot. 205 Capriole Ct is a home located in Tarrant County with nearby schools including Colleyville Elementary School, Colleyville Middle School, and Grapevine High School.
Ownership History
Date
Name
Owned For
Owner Type
Purchase Details
Closed on
Mar 23, 2020
Sold by
Jones Edward and Jones Patricia
Bought by
Jones Kristi
Current Estimated Value
Purchase Details
Closed on
Mar 21, 2020
Sold by
Jones Edward Alan and Jones Patricia Martinez
Bought by
Jones Kristi
Purchase Details
Closed on
Jun 27, 2019
Sold by
Stasik Barbara H
Bought by
Jones Kristi and Jones Edward
Home Financials for this Owner
Home Financials are based on the most recent Mortgage that was taken out on this home.
Original Mortgage
$661,600
Outstanding Balance
$581,748
Interest Rate
4%
Mortgage Type
New Conventional
Estimated Equity
$629,789
Purchase Details
Closed on
Apr 27, 2004
Sold by
Mills Custom Homes Inc
Bought by
Stasik David A and Stasik Barbara H
Home Financials for this Owner
Home Financials are based on the most recent Mortgage that was taken out on this home.
Original Mortgage
$333,700
Interest Rate
5.53%
Mortgage Type
Purchase Money Mortgage
Create a Home Valuation Report for This Property
The Home Valuation Report is an in-depth analysis detailing your home's value as well as a comparison with similar homes in the area
Home Values in the Area
Average Home Value in this Area
Purchase History
| Date | Buyer | Sale Price | Title Company |
|---|---|---|---|
| Jones Kristi | -- | Ftd | |
| Jones Kristi | -- | None Available | |
| Jones Kristi | -- | Fatico | |
| Stasik David A | -- | Fidelity Natl Title-Irving |
Source: Public Records
Mortgage History
| Date | Status | Borrower | Loan Amount |
|---|---|---|---|
| Open | Jones Kristi | $661,600 | |
| Previous Owner | Stasik David A | $333,700 |
Source: Public Records
Tax History Compared to Growth
Tax History
| Year | Tax Paid | Tax Assessment Tax Assessment Total Assessment is a certain percentage of the fair market value that is determined by local assessors to be the total taxable value of land and additions on the property. | Land | Improvement |
|---|---|---|---|---|
| 2025 | $3,979 | $939,000 | $214,250 | $724,750 |
| 2024 | $3,979 | $977,199 | $214,250 | $762,949 |
| 2023 | $16,392 | $1,086,194 | $214,250 | $871,944 |
| 2022 | $17,447 | $999,226 | $214,250 | $784,976 |
| 2021 | $17,636 | $803,071 | $200,000 | $603,071 |
| 2020 | $17,256 | $776,570 | $200,000 | $576,570 |
| 2019 | $17,717 | $766,300 | $200,000 | $566,300 |
| 2018 | $4,219 | $709,627 | $150,000 | $559,627 |
| 2017 | $15,923 | $674,009 | $150,000 | $524,009 |
| 2016 | $16,265 | $710,258 | $150,000 | $560,258 |
| 2015 | $14,307 | $625,900 | $65,000 | $560,900 |
| 2014 | $14,307 | $625,900 | $65,000 | $560,900 |
Source: Public Records
Map
Nearby Homes
- 200 Valley View Dr N
- 5609 Oak Top Dr
- 5800 Hunter Trail
- 613 Colts Neck Ct
- 5902 Preston Way
- 6004 Hunter Ct
- 203 Oak Valley Dr
- 5913 Preston Way
- 5803 Chalford Common
- 217 Oak Valley Dr
- 203 Polo Trail
- 621 Trails End Ct
- 407 Timberline Dr N
- 5509 Texas Trail
- 6401 Westcoat Dr
- 5903 Crescent Ln
- 803 Marie Dr
- 5918 Crescent Ln
- 712 Bear Creek Dr
- 6108 Westcoat Dr
- 201 Capriole Ct
- 200 Capriole Ct
- 208 Capriole Ct
- 204 Capriole Ct
- 206 W Ld Lockett Rd
- 211 W Ld Lockett Rd
- 201 W Ld Lockett Rd
- 207 Gallant Ct
- 201L W Ld Lockett Rd
- 5808 Chestnut Bend
- 211 Gallant Ct
- 203 Gallant Ct
- 5801 Quails Path
- 202 W Ld Lockett Rd
- 5812 Chestnut Bend
- 5806 Bettinger Dr
- 5809 Quails Path
- 5808 Bettinger Dr
- 5900 Chestnut Bend
- 305 W Ld Lockett Rd