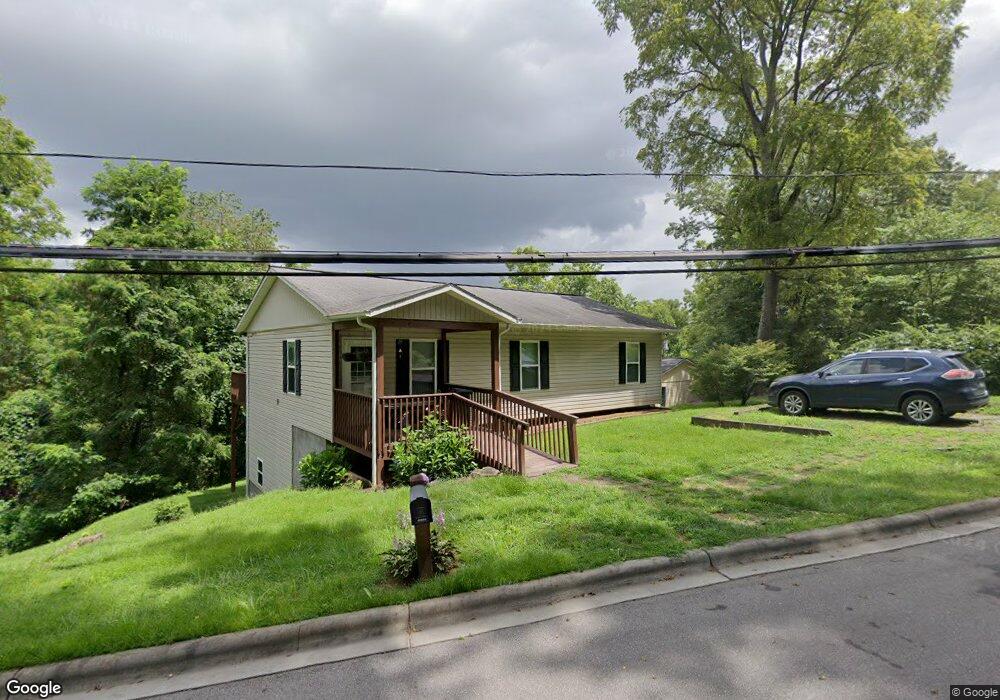
205 Carson St Canton, NC 28716
Estimated Value: $299,372 - $388,000
3
Beds
2
Baths
1,218
Sq Ft
$274/Sq Ft
Est. Value
About This Home
This home is located at 205 Carson St, Canton, NC 28716 and is currently estimated at $334,093, approximately $274 per square foot. 205 Carson St is a home with nearby schools including North Canton Elementary School, Canton Middle, and Pisgah High School.
Ownership History
Date
Name
Owned For
Owner Type
Purchase Details
Closed on
Jul 22, 2021
Sold by
2020 Builders Llc
Bought by
Molly May Investments Llc
Current Estimated Value
Purchase Details
Closed on
May 8, 2013
Sold by
Haywood Habitat For Humanity Inc
Bought by
Jones Wendy Delois
Home Financials for this Owner
Home Financials are based on the most recent Mortgage that was taken out on this home.
Original Mortgage
$75,000
Interest Rate
3.59%
Mortgage Type
Seller Take Back
Create a Home Valuation Report for This Property
The Home Valuation Report is an in-depth analysis detailing your home's value as well as a comparison with similar homes in the area
Home Values in the Area
Average Home Value in this Area
Purchase History
| Date | Buyer | Sale Price | Title Company |
|---|---|---|---|
| Molly May Investments Llc | -- | Stephen Barnwell Pllc | |
| Jones Wendy Delois | $142,500 | None Available |
Source: Public Records
Mortgage History
| Date | Status | Borrower | Loan Amount |
|---|---|---|---|
| Previous Owner | Jones Wendy Delois | $75,000 |
Source: Public Records
Tax History
| Year | Tax Paid | Tax Assessment Tax Assessment Total Assessment is a certain percentage of the fair market value that is determined by local assessors to be the total taxable value of land and additions on the property. | Land | Improvement |
|---|---|---|---|---|
| 2025 | -- | $173,400 | $23,000 | $150,400 |
| 2024 | $11 | $173,400 | $23,000 | $150,400 |
| 2023 | $1,113 | $173,400 | $23,000 | $150,400 |
| 2022 | $1,087 | $173,400 | $23,000 | $150,400 |
| 2021 | $1,087 | $173,400 | $23,000 | $150,400 |
| 2020 | $968 | $138,300 | $19,700 | $118,600 |
| 2019 | $973 | $138,300 | $19,700 | $118,600 |
| 2018 | $973 | $138,300 | $19,700 | $118,600 |
| 2017 | $973 | $138,300 | $0 | $0 |
| 2016 | $894 | $129,000 | $0 | $0 |
| 2015 | $894 | $129,000 | $0 | $0 |
| 2014 | -- | $129,000 | $0 | $0 |
Source: Public Records
Map
Nearby Homes
Your Personal Tour Guide
Ask me questions while you tour the home.