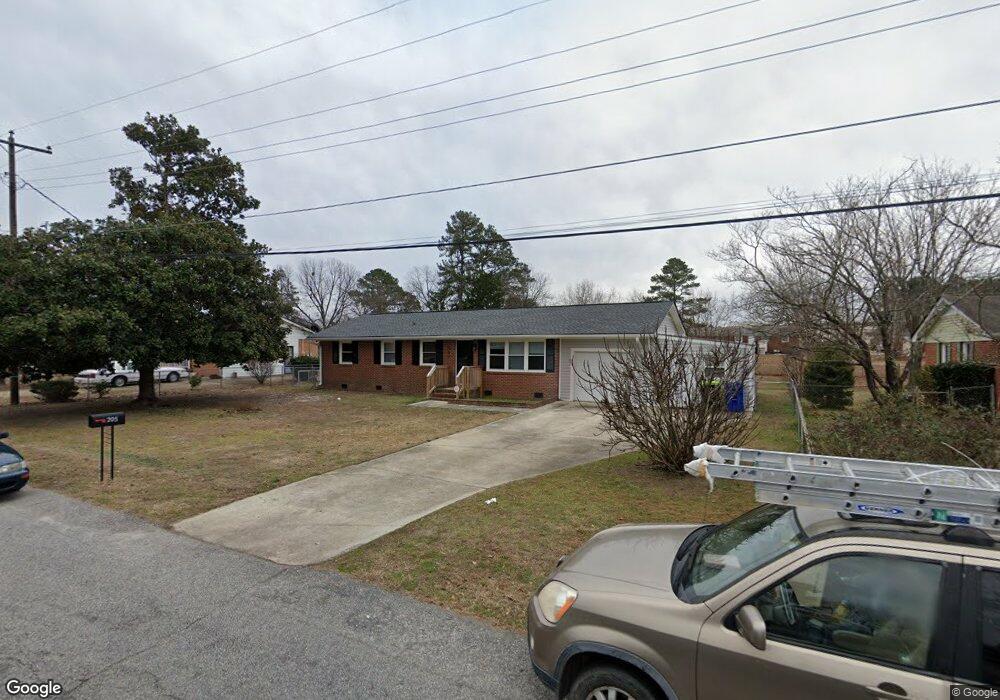
205 Cecil Ave Unit 22 Spring Lake, NC 28390
Estimated Value: $193,000 - $200,000
3
Beds
2
Baths
1,534
Sq Ft
$129/Sq Ft
Est. Value
About This Home
This home is located at 205 Cecil Ave Unit 22, Spring Lake, NC 28390 and is currently estimated at $198,194, approximately $129 per square foot. 205 Cecil Ave Unit 22 is a home located in Cumberland County with nearby schools including Manchester Elementary School, Spring Lake Middle, and Pine Forest High.
Ownership History
Date
Name
Owned For
Owner Type
Purchase Details
Closed on
Dec 10, 2025
Sold by
Justice Donivan and Justice Jocelyn
Bought by
Miller Delano Keith and Miller Kimberly Collette
Current Estimated Value
Home Financials for this Owner
Home Financials are based on the most recent Mortgage that was taken out on this home.
Original Mortgage
$199,000
Outstanding Balance
$198,619
Interest Rate
6.22%
Mortgage Type
VA
Estimated Equity
-$425
Purchase Details
Closed on
Jun 22, 2023
Sold by
Ross Gregory
Bought by
Justice Donivan
Home Financials for this Owner
Home Financials are based on the most recent Mortgage that was taken out on this home.
Original Mortgage
$183,767
Interest Rate
6.39%
Mortgage Type
VA
Purchase Details
Closed on
Aug 11, 2022
Sold by
Mdn Rentals Llc
Bought by
Ross Gregory
Purchase Details
Closed on
May 18, 2022
Sold by
Brittain Iii Charles M
Bought by
Mdn Rentals Llc
Create a Home Valuation Report for This Property
The Home Valuation Report is an in-depth analysis detailing your home's value as well as a comparison with similar homes in the area
Home Values in the Area
Average Home Value in this Area
Purchase History
| Date | Buyer | Sale Price | Title Company |
|---|---|---|---|
| Miller Delano Keith | $199,000 | None Listed On Document | |
| Justice Donivan | $180,000 | None Listed On Document | |
| Ross Gregory | $143,000 | Real Estate Law Firm | |
| Mdn Rentals Llc | $65,000 | Brittan Charles M |
Source: Public Records
Mortgage History
| Date | Status | Borrower | Loan Amount |
|---|---|---|---|
| Open | Miller Delano Keith | $199,000 | |
| Previous Owner | Justice Donivan | $183,767 |
Source: Public Records
Tax History
| Year | Tax Paid | Tax Assessment Tax Assessment Total Assessment is a certain percentage of the fair market value that is determined by local assessors to be the total taxable value of land and additions on the property. | Land | Improvement |
|---|---|---|---|---|
| 2025 | $3,021 | $148,848 | $25,000 | $123,848 |
| 2024 | $3,021 | $99,364 | $11,000 | $88,364 |
| 2023 | $1,581 | $99,364 | $11,000 | $88,364 |
| 2022 | $1,395 | $86,619 | $11,000 | $75,619 |
| 2021 | $0 | $86,619 | $11,000 | $75,619 |
| 2019 | $1,366 | $70,400 | $11,000 | $59,400 |
| 2018 | $1,366 | $70,400 | $11,000 | $59,400 |
| 2017 | $1,366 | $70,400 | $11,000 | $59,400 |
| 2016 | $1,503 | $82,800 | $11,000 | $71,800 |
| 2015 | $1,503 | $82,800 | $11,000 | $71,800 |
| 2014 | $1,503 | $82,800 | $11,000 | $71,800 |
Source: Public Records
Map
Nearby Homes
- 222, 226, 228 and 23 Odell Rd
- 222 Odell Rd
- 226 Odell Rd
- 230 Odell Rd
- 1421 Mack St
- 130 Chapel Hill Rd
- 142 Chapel Hill Rd
- 144 Chapel Hill Rd
- 1419 N Bragg Blvd
- 1540 Mack St
- 137 New St
- 310 Old Hertford Ln
- 0 W Manchester Rd
- 1405 Romie St
- 609 Regina Dr
- 313 Laketree Blvd
- 109 Ashton Place
- 610 Duncan Rd
- 705 Eva Cir
- 1600 Easterling Dr
Your Personal Tour Guide
Ask me questions while you tour the home.