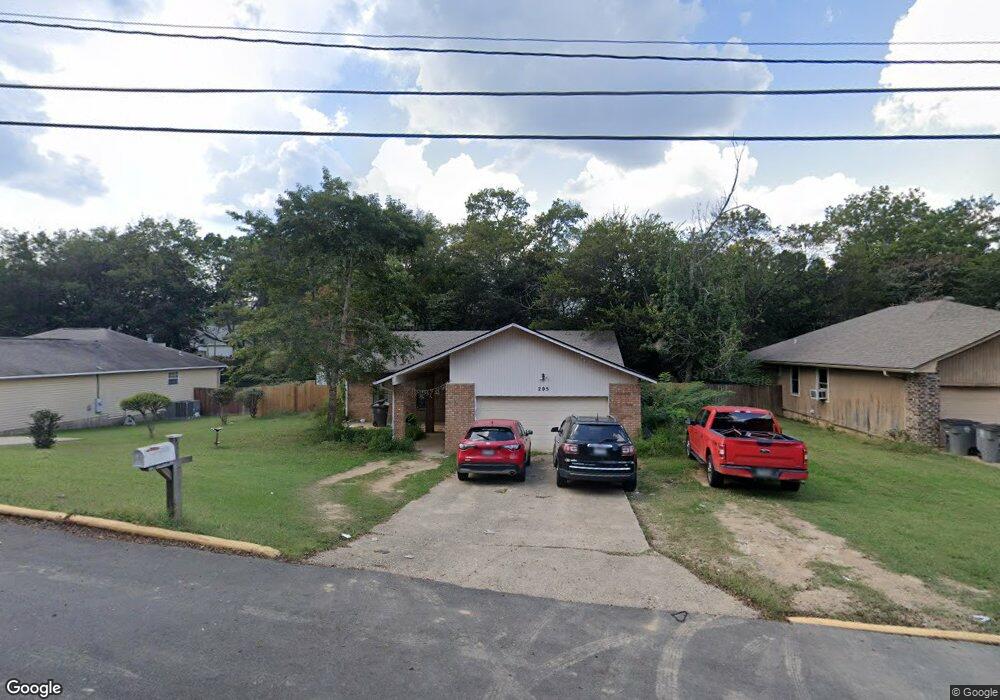
205 Cedarwood Dr Hot Springs, AR 71901
Estimated Value: $183,000 - $229,000
3
Beds
2
Baths
1,503
Sq Ft
$140/Sq Ft
Est. Value
About This Home
This home is located at 205 Cedarwood Dr, Hot Springs, AR 71901 and is currently estimated at $210,122, approximately $139 per square foot. 205 Cedarwood Dr is a home located in Garland County with nearby schools including Lakeside Primary School, Lakeside Intermediate School, and Lakeside Junior High School.
Ownership History
Date
Name
Owned For
Owner Type
Purchase Details
Closed on
Dec 2, 2021
Sold by
Souza Gregory T and Souza Mary Lou
Bought by
Porter Aaron J and Porter Tabitha C
Current Estimated Value
Home Financials for this Owner
Home Financials are based on the most recent Mortgage that was taken out on this home.
Original Mortgage
$139,329
Outstanding Balance
$127,847
Interest Rate
3.09%
Mortgage Type
New Conventional
Estimated Equity
$82,275
Purchase Details
Closed on
Mar 31, 2006
Sold by
Thomas Gail J
Bought by
Souza Gregory T and Souza Mary Lou L
Home Financials for this Owner
Home Financials are based on the most recent Mortgage that was taken out on this home.
Original Mortgage
$82,500
Interest Rate
6.22%
Mortgage Type
New Conventional
Purchase Details
Closed on
Jan 1, 1901
Bought by
Thomas James O
Create a Home Valuation Report for This Property
The Home Valuation Report is an in-depth analysis detailing your home's value as well as a comparison with similar homes in the area
Home Values in the Area
Average Home Value in this Area
Purchase History
| Date | Buyer | Sale Price | Title Company |
|---|---|---|---|
| Porter Aaron J | $141,900 | None Listed On Document | |
| Porter Aaron J | $141,900 | None Listed On Document | |
| Souza Gregory T | $110,000 | Garland County Title Company | |
| Thomas James O | -- | -- |
Source: Public Records
Mortgage History
| Date | Status | Borrower | Loan Amount |
|---|---|---|---|
| Open | Porter Aaron J | $139,329 | |
| Closed | Porter Aaron J | $139,329 | |
| Previous Owner | Souza Gregory T | $82,500 |
Source: Public Records
Tax History Compared to Growth
Tax History
| Year | Tax Paid | Tax Assessment Tax Assessment Total Assessment is a certain percentage of the fair market value that is determined by local assessors to be the total taxable value of land and additions on the property. | Land | Improvement |
|---|---|---|---|---|
| 2025 | $1,539 | $33,820 | $2,880 | $30,940 |
| 2024 | $1,519 | $33,820 | $2,880 | $30,940 |
| 2023 | $1,519 | $33,820 | $2,880 | $30,940 |
| 2022 | $1,519 | $33,820 | $2,880 | $30,940 |
| 2021 | $1,025 | $22,620 | $2,000 | $20,620 |
| 2020 | $1,025 | $22,620 | $2,000 | $20,620 |
| 2019 | $1,025 | $22,620 | $2,000 | $20,620 |
| 2018 | $1,025 | $22,620 | $2,000 | $20,620 |
| 2017 | $993 | $22,620 | $2,000 | $20,620 |
| 2016 | $954 | $21,740 | $2,400 | $19,340 |
| 2015 | $898 | $21,740 | $2,400 | $19,340 |
| 2014 | $897 | $21,740 | $2,400 | $19,340 |
Source: Public Records
Map
Nearby Homes
- 205 Cedarwood St
- 207 Cedarwood St
- 113 Cedarwood St
- 102 Cedarwood Ct
- 200 Vale St
- 111 Cedarwood St
- 104 Vale St
- 209 Cedarwood St
- 109 Cedarwood St
- 109 Cedarwood Dr
- 211 Cedarwood St
- 204 Vale St
- 103 Brentwood St
- 210 Cedarwood St
- 104 Cedarwood Ct
- 107 Cedarwood St
- 100 Vale St
- 213 Cedarwood St
- 103 Cedarwood Ct
- 206 Vale St